Download
1 / 34
340 likes | 491 Views
Social i nequality and voter turnout - evidence from EU elections. Daniel Horn TÁRKI GINI Year-One Conference February 4-5. 2011. Milan. Introduction. Why people vote? Individual explanations rational choice (Downs 1957, Tulock 1967, Riker and Ordershook 1968, Muller 2003)

E N D
Social inequality and voter turnout - evidence from EU elections Daniel Horn TÁRKI GINI Year-One Conference February 4-5. 2011. Milan
Introduction • Why people vote? • Individual explanations • rational choice (Downs 1957, Tulock 1967, Riker and Ordershook 1968, Muller 2003) • social capital (Putnam 2000), social status (Lijphart 1997) • civic resources (Verba, Schlotzman, Brady 1995) • Macro explanations (see e.g. Geys 2006) • socio economic (population size, - stability, - concentration, -homogenity) • political variables (closeness, campaign spendings, fragmentation) • institutional variables (electoral system, compulsory voting, concurrent elections, registration requirements) But how does inequality associate with voter turnout? Does higher inequality drive more people to cast a vote? Or does it hinder this form of political participation? Daniel Horn
Additional motivation • The link between inequality and redistribution is thought to be well established (Meltzer and Richard 1981). • lower income people prefer more redistribution • higher turnout is likely to be driven by higher turnout of lower income people, who demand more redistribution (the median voter is moving to the „left”) • thus the association between inequality and redistibution is mediated by voter turnout (see Lacrinese 2007) So the association between inequality and voter turnout is interesting as a part of the governmental redistribution topic as well. Daniel Horn
Possible explanations • Three possible ways of asociation bw/ inequality and voter turnout • negative • positive • none (less interesting) Daniel Horn
Possible explanations - negative • Changing political agenda (Solt 2010, Schattschneider 1960) • rich are better able to set the political agenda. When social inequality is high, this „advantage” is higher, hence voter turnout of the poor is lower • Social norms (Lister 2007) • institutions (such as the welfare state) influence social norms, and hence individual behavior. In more equal societies (c.f. universalist welfare states) we should observe higher levels of political participation • Reverse causation – class bias (Muller and Stratmann 2003, but see the logic of Meltzer and Richard 1981) • Upper classes (rich) participate more (Lijphart 1997). Lower voter turnout benefits upper classes, which leads to socially unjust policies and thus social inequality. Daniel Horn
Possible explanations - positive • Heterogeneity increases voter turnout (Zimmer 1976) • If the government performs redistributive actions, homogeneous groups with high political power can gain much (many homogeneous groups = heterogeneous society) • Or alternatively: • If social tensions are high, relatively homogeneous groups of people (poor, elderly, students… etc.) are easier to mobilize (citation needed!) • „societies with deep divisions between socialgroups that are linked to specific parties are more likely to see high turnout thansocieties in which the decline of cleavage politics has reduced the importance ofthese links”(Franklin et al., 1992, citation from van der Eijk et al 1996). Daniel Horn
Empirical evidence so far: All negative! Increasing inequality associates with decreasing voter turnout. Lister (2007) – Comparative Welfare States dataset: Macro data for 15 countries, 1963-1993. Mueller and Stratmann (2003) – Macro level data for 76 countries, 1960-1990. Solt (2010): US Gubernatorial Elections • Individual dataset (~240 thousand, in 6 elections 1978-2000) • post-tax Gini as income inequality Daniel Horn
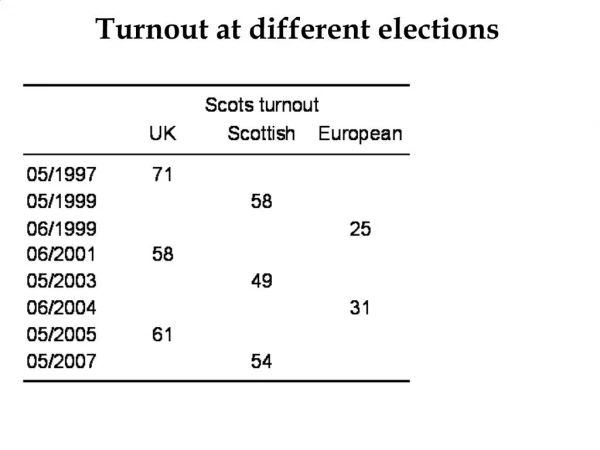
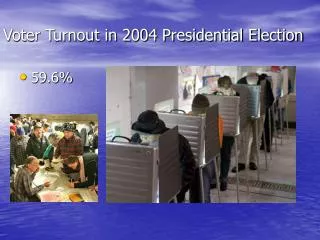
Data • 5 European elections (European Election Survey 1989-2009 – PIREDEU database) • Disadvantage: „second-order election” (Reif and Schmitt 1980) • turnout is lower than in national parliamentary elections, affected by • the closeness of the next parliamentary election • complusory voting • and other „endogeneous” factors, like pro-European feeelings • and continuously falling (1979: 63%, 1989: 58,5%, 1999: 49,4%, 2009: 43%) but • it seems that „voters go to the polls because of a desire for political influence. Moreover there is no evidence of different processes at work in different countries.” (Franklin, van der Ejik and Oppenhuis 1996, p. 330) • and „The second-order election model implies that it is more likely that nationalelections will effect European elections than vice-versa, but in reality we findinfluencesrunning in both directions.” (van der Eijk et al. 1996) • Advantage: • similar everywhere (smaller institutional effects) • must be PR system (~UK) • can only be subdivided to regions if this does not affect the PR nature • maximum 5% threshold • taken at the same time • no unexpected effects (e.g. early elections) Daniel Horn
Data (individual level) • European Election Study • phone interviews • after elections • approx. 150.000 individuals in 5 years (~3000 people/country until 1994; ~1000 in 1999, 2004 – 2009 is in preparation) • questions about participation and individual background (no income) – and much more (controls: age, sex, education, class, settlement, church, voted last parl. elect.) Daniel Horn
Data (country level) • National data • Next election in days/365 (wikipedia) • Compulsory voting (IDEA, www.idea.int) • GDP/capita (Eurostat 1995-2004) and Nationmaster (WDI database - 1989) • Nationality – consider herself belong to other nationality (EES 2009) • Inequality • (post-tax) Gini for each year (Eurostat - SILC) • pre-tax Gini (Social Situation Observatory Annual Montioring Report 2009) • Gini indices of the distribution of equivalent household market income among the working age 2004 • MDMI (Lancee - v. d. Werfhorts 2011) • poverty - Population at risk of poverty or social exclusion 2005 (Eurostat) (Bulgaria 2006, Romania 2007) Daniel Horn
Voter turnout - EES Daniel Horn
Own calculationsDescriptive Daniel Horn
Own calculationsLowess smoothing Daniel Horn
Methods • Pooled logit with clustered standard errors • two 2-step probits • fixed effect: • 1st step: individual controls and country fixed marginal effects • 2nd step: country controls and inequality indicators • separate country regressions • 1st step: individual controls for each country and probabilities are predicted (for 42 year old middle class women, who live in mid-size settlement, with 12 years of education, and voted in parl. elections.) • 2nd step: country controls and inequality indicators • Multilevel mixed effect logit (no weighting) Daniel Horn
Base model All variables here are included in each regression below. Country level variables Daniel Horn
Pooled logit Daniel Horn
Pooled logit – other indicators Daniel Horn
Social norms • universal welfare state -> more equal and higher turnout Daniel Horn
Changing political agenda /Class biasIf inequality increases rich are more likely to vote than the poor Daniel Horn
Conclusion • „conventional” results for the base model (compulsory voting, voted last election… etc.) • so results for european „second-order” elections work as first-order elections • but unconvetional results for the inequality dimesion: • Inequality and voter turnout associates positively or in a quadratic relation • Negative association is less likely to hold • Social norms theory does not explain low levels of turnout for universal welfare states (e.g. Sweden, Finland, Denmark, Netherlands) • Political agenda/ Class bias theories does not explain coparatively higher rising levels of turnout for the working class • Theories of positive association are yet to be confirmed Daniel Horn
Questions • Whether it is due to • the quality of the data • the „second-order” nature of the EU elections • the fact that aggregate data works differently than individual (ecological fallacy) • the fact that US inequality is higher (cf. Solt 2010) and very low inequality and very high inequality both predicts low turnout compared to the middle are all open to further research. Daniel Horn
Thank you for your attention! Daniel Horn horndnl@gmail.com
Note: ----------- X=Y line Daniel Horn
Country fixed effects Daniel Horn
Separate country regressions Daniel Horn
Multilevel logit Daniel Horn
Changing political agenda /Class bias • If inequality increases rich are more likely to vote than the poor Daniel Horn