Download
1 / 21
210 likes | 341 Views
Voter turnout and civic participation in the EU. Overview. Relevance of participation Turnout in EP elections Development since 1979 Comparison with NP elections Types of voters Multivariate analysis 3. Non-electoral participation in Europe Frequencies

E N D
Overview • Relevance of participation • Turnout in EP elections • Development since 1979 • Comparison with NP elections • Types of voters • Multivariate analysis 3. Non-electoral participation in Europe • Frequencies • Dimensions of non-electoral participation • Multivariate analysis
Relevance of participation • Two important approaches in theories of democracy: • Input-oriented approaches: aim: maximum of turnout/participation low turnout/participation: declining support, symptom for a crisis • Output-oriented approaches: elections as an instrument for the allocation of power and legitimation of the political system low turnout/participation: satisfaction and consent with the political system General evaluation of turnout/participation level is quite difficult.
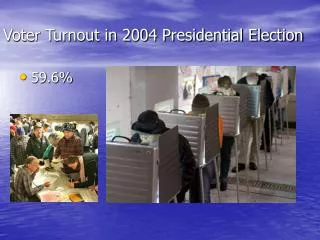
Turnout in EP election 2004 compulsory voting EU-turnout: 45.7%
Database for analysis of turnout • Mass survey from Intune-project http://www.intune.it/ • Timing: March-April 2007 • 17 European countries: AT, BE, BG, DE, DK, EE, EL, ES, FR, HU, IT, PL, PT, SI, SK, SR, UK • Turnout: last EPE, last NPE
Logistic regression: Turnout EPE • Nagelkerke‘s R2= 0.252 • Most important predictors: • Perceived duty to vote (EU/Nat.) + • Strength of party identification + • Media consumption + • EU support + • Internal efficacy + • EU identity + • Trust in EU institutions -
Logistic regression: EPE-only (1)versus NPE-only (0) voters • Nagelkerke‘s R2= 0.103 • Most important predictors: • Strength of party identification - • EU Identity + • Satisfaction with democracy EU - • EU Benefit + • Class + • Perceived economic situation - • Urbanisation -
Logistic regression: EPE- and NPE-voters (1) vs. NPE-only (0) voters • Nagelkerke‘s R2= 0.134 • Most important predictors: • Perceived duty to vote (EU/nat.) + • Media consumption + • Strength of party identification + • EU Identity + • EU Support + • Perceived economic situation - • Internal efficacy +
Conclusions turnout EPE • Important variables for turnout in EPE: • Perceived duty to vote • Strength of party identification • EU Identity/Support/Trust • Possibilities to boost turnout in EPE: • Raise perceived importance of European level • Emphasise duty to vote
Database for analysis of civic participation • ESS, Round 1, 2002/03 • 17 EU member states: AT, BE, CZ, DE, DK, ES, FI, FR, GB, GR, HU, IE, IT, LU, NL, PL, PT, SE, SI • 11 forms of non-electoral participation: contact politician, work in party, work in organisation, display badge, sign petition, public demonstration, boycott product, buy product, donate money, illegal protest, party member
Multivariate regression: conventional participation • R2= 0.143 • Most important predictors: • Strength of party identification + • Internal efficacy + • Social participation + • Perceived duty to participate + • Interest in politics + • Woman - • Age +
Multivariate regression: consumerism • R2= 0.199 • Most important predictors: • Social participation + • Woman + • Interest in politics + • Education + • Income + • Internal efficacy + • Left-right-scale -
Multivariate regression:protest activities • R2= 0.034 • Most important predictors: • Social participation + • Left-right-scale - • Age - • Strength of party identification + • Income - • Internal efficacy + • Religious attendance - • Perceived duty to participate +
Multivariate regression:participation index • R2= 0.289 • Most important predictors: • Social participation + • Internal efficacy + • Strength of party identification + • Interest in politics + • Left-right-scale - • Education + • Income +
Conclusions non-electoral participation • Only minorities participate in non-electoral participation • Social participation as important predictor for all non-electoral forms of participation • Besides social participation: very heterogeneous explanations