Download
1 / 34
340 likes | 516 Views
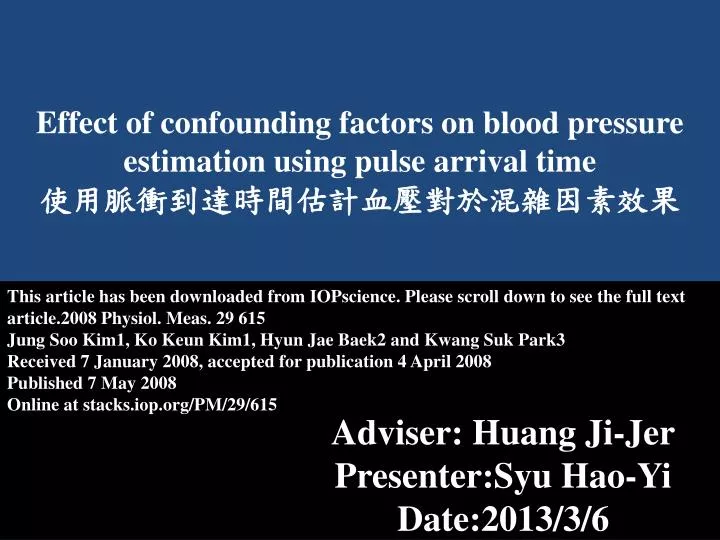
Effect of confounding factors on blood pressure estimation using pulse arrival time 使用脈衝到達時間估計血壓對於混雜因素 效果. This article has been downloaded from IOPscience . Please scroll down to see the full text article.2008 Physiol. Meas. 29 615

E N D
Effect of confounding factors on blood pressure estimation using pulse arrival time 使用脈衝到達時間估計血壓對於混雜因素效果 This article has been downloaded from IOPscience. Please scroll down to see the full text article.2008 Physiol. Meas. 29 615 Jung Soo Kim1, KoKeun Kim1, Hyun Jae Baek2 and KwangSuk Park3 Received 7 January 2008, accepted for publication 4 April 2008 Published 7 May 2008 Online at stacks.iop.org/PM/29/615 Adviser: Huang Ji-Jer Presenter:SyuHao-Yi Date:2013/3/6
Outline • Review1 • Introduction • Methods • Results • Discussion and Conclusions • Review2 • Introduction • Multiscale Mathematical Morphology Theory • Proposed Implementation Scheme • Discussions on Structure Elements • Experimental Results • Conclusion • References
Introduction • With the increasing need for non-intrusive measurement of blood pressure (BP), blood pressure estimation with pulse arrival time (PAT) was recently developed, replacing conventional constrained measurement by auscultatory and oscillometric methods using a mechanical cuff
Introduction • The method needs to be calibrated for each individual using a regression process. This was presented as inter- and intra-subject analyses in our previous study .PAT was obtained from ECG and photoplethysmogram(PPG) measured non-intrusively
Introduction • The purpose of this study is to evaluate the effect of heart rate (HR) and arterial stiffness in BP estimation with PAT
Methods • Confounding factor—HR • Blood pressure is related to heart rate as well as to PAT in the cardiovascular system Confounding factor—HR Confounding factor—arterial stiffness Experiments
Methods Correlation coefficients of SBP and DBP with the HR or RR interval. HR shows aslightly higher correlation with both SBP and DBP than with the RR interval.
Methods • Confounding factor—arterial stiffness • Arterial stiffness is known to be related to BP • Pulse wave velocity (PWV)、Augmentation index (AI)(Using a catheter or a tonometer) • another robust and noninvasive method for assessing arterial stiffness is needed
Methods • Amplitude parameters • Time parameters • Slope parameters Comparable parameters of arterial stiffness in PPG.
Methods • shows the results of correlation analysis between these 16 parameters and BP for five individual subjects
Methods • Experiments • Experiments for parameter selection and evaluation of the results were performed using ten male subjects with an average age of 28 years (25–32 years)
Results Correlation of blood pressure with confounding factors Single and multiple regression analysis Reproducibility
Results • Correlation of blood pressure with confounding factors Correlation between BP and BP estimating parameters for patient A
Results • Single and multiple regression analysis • (BP = a + b∗PAT + c∗HR + d∗TDB) (BP = a + b∗PAT + c∗HR + d∗TDB)
Results (BP = a + b∗PAT + c∗HR + d∗TDB)
Results • Reproducibility Reproducibility of multiple regression analysis for BP estimation. The test was conducted for a week. The estimated BP from the regression equation of the training set was compared with the measured BP. The correlation coefficients decreased a little with 0.7714 and 0.8432 for SBP and DBP. However, such a level of correlation should still be enough for the estimation of BP
Discussion and Conclusion • Correlation with blood pressure • Waveform analysis of PPG • Limitation of the study • Application to home health care
Review2 QRS Detection Based on Multiscale Mathematical Morphology for Wearable ECG Devices in Body Area Networks This paper appears in: Biomedical Circults and System,IEEE Transactions onDate of Publication: Aug. 2009Author(s): Fei Zhang Dept. of Electr. & Comput. Eng., Nat. Univ. of Singapore, Singapore, Singapore Yong LianVolume: 3 , Issue: 4 Page(s): 220 - 228 Product Type: Journals & Magazines
Introduction • Introducing the multiscale mathematical morphology(3M) filtering concept into QRS detection
Proposed Implementation Scheme Multiscale Mathematical Morphology Filtering Differential Operation Enhancing ECG by Modulus and Combination Threshold and Decision
Proposed Implementation Scheme • The structure element plays an important role in the 3M filter. Its shape, amplitude, and length affect the output of the morphology filter
Proposed Implementation Scheme • Multiscale Mathematical Morphology Filtering -The top-hat operator produces an output consisting of the signal peaks -the bottom-hat operator extracts the valleys (negative peaks)
Proposed Implementation Scheme • Multiscale Mathematical Morphology Filtering • J is the largest filtering scale • The multiscale opening and closing filtering • Thethe weighted sum of the top-hat and bottom-hat transformations at the scale from 1 to J
Proposed Implementation Scheme • Multiscale Mathematical Morphology Filtering Implementation scheme of the proposed 3M filter for J=3 Power consumption is an important consideration in the design of wearable devices. The ideal QRS detection solution should avoid the use of multiplier(s) in order to reduce the power
Proposed Implementation Scheme • Differential Operation -After 3M filtering, the output ECG sequence is differentiated in order to remove motion artifacts and baseline drifts
Proposed Implementation Scheme • Enhancing ECG by Modulus and Combination • The absolute value of the differential output is combined by multiple-frame accumulation The value ofq should correspond to the possible maximum duration of the normal QRS complex
Proposed Implementation Scheme • Threshold and Decision • The detection of a QRS complex is accomplished by comparing the feature against a threshold
Experimental Results • The MIT/BIH Arrhythmia Database is used to evaluate our algorithm
Experimental Results • False Negative(FN)、False Positive (FP)、Sensitivity (Se)、Positive Prediction(+P)、Detection error (DER) 、True positive (TP)
Conclusion • We have presented a computationally efficient QRS detection algorithm for the resting and exercise ECG • Using Differential modulus accumulation to reduce the noise in the ECG signal • The algorithm is evaluated against the MIT/BIH database and achieves a detection rate of 99.61%, a sensitivity of 99.81%, and a positive prediction of 99.80%
References • Effect of confounding factors on blood pressure estimation using pulse arrival time Jung Soo Kim1, KoKeunKim, Hyun Jae Baekand KwangSukPark • QRS Detection Based on Multiscale Mathematical Morphology for Wearable ECG Devices inBody Area Networks Fei Zhang and Yong Lian, Fellow, IEEE