Download
1 / 47
880 likes | 1.93k Views
Blood Pressure. Blood Pressure. Fig 15-4. Hydrostatic Pressure created by ventricular contractility becomes the driving force for blood flow Pulsatile blood flow in arteries Elastic arteries expand and recoil for continuous blood flow. This is the “pulse” that we can feel.

E N D
Blood Pressure Fig 15-4 Hydrostatic Pressure created by ventricular contractility becomes the driving force for blood flow Pulsatile blood flow in arteries Elastic arteries expand and recoil for continuous blood flow. This is the “pulse” that we can feel. Pulse wave disappears past arterioles and the precapillary sphincters
Arteries vs. Veins • Endothelial lining throughout the cardiovascular system and heart • Less sticky than teflon • Arteries have more smooth muscle than veins • Arteries can vasoconstrict • Veins are “stretchy” or compliant • Veins have valves to prevent backflow of blood • Arteries don’t have backflow due to pressure gradient
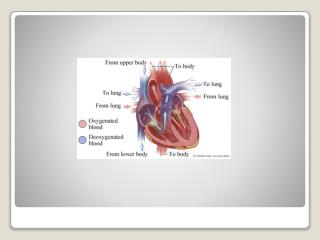
Cardiovascular System • Blood Flow • Aorta to major arteries to minor arteries entering organs to arterioles to capillaries to venules to veins leaving organs to vena cava • Cardiovascular system transports materials throughout the body • Nutrients, water, gases • Materials that move from cell to cell • Wastes that the cells eliminate
Why Does Blood Flow? • Liquids and gases flow down pressure gradients (ΔP) • A region of higher pressure to a region of lower pressure • Blood can flow in the cardiovascular system only if one region develops higher pressure than other regions
Pressure Gradients • Pressure is created in the chambers of the heart when they contract • Blood flows out of the heart • The higher region of pressure • As blood moves through the system pressure is lost due to friction between the fluid and the vessel walls • Pressure falls the farther the blood moves from the heart • Higher pressure in the aorta • Lowest pressure in the venae cavae just before they empty into the right atrium
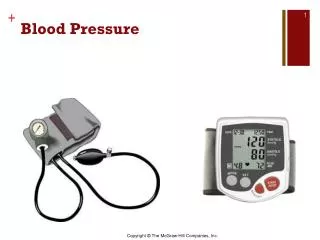
Blood Pressure (BP) Measurements • Ventricular pressure difficult to measure measure arterial BP • BP highest in the arteries – falls continuously throughout systemic circulation (Why?) • Read as “Systolic over diastolic”– normal value 120 / 80 mm Hg • 2003: New range for blood pressure readings between 120/80 and 139/89 “Prehypertension” • Diastolic pressure in ventricle: ? mm Hg Blood Flow Rate P/ R
Pressure of Fluid in Motion Decreases over Distance • Pressure in a fluid is the force exerted by the fluid on its container • The container is the wall of the artery for blood pressure • Hydrostatic Pressure • The pressure exerted if the fluid is not moving • Force is exerted equally in all directions on the container
Capillaries • Capillaries contain sphincters • Sphincters are typically closed to 90% of the body • During exercise sphincters all open • Better perfusion
Veins are Capacitance Vessels • Veins have little smooth muscle • Veins are “stretchy” • The stretch is called capacitance • The more the stretch the less pressure is exerted against the walls • Veins are located between muscle • Skeletal, smooth, cardiac • Veins contain valves • Varicose Veins • Venous Return • Blood flowing back to the heart through veins
Cardiovascular Physiology • Blood Pressure is controlled by: • Heart Rate • Peripheral Resistance • Blood Viscosity • Blood Volume • Stroke Volume
Heart Rate • Tachycardia • Faster than 60-100 bpm • Bradycardia • Slower than 60 bpm
Cardiovascular Physiology • CO = HR X SV Cardiac Output = Heart Rate X Stroke Vol • SV = EDV – ESV • Stroke Vol = End Diastolic Vol – End Systolic Vol • BP = CO x PR • Blood Pressure = Cardiac Output X Peripheral Resistance • FRANK-STARLING’S LAW
Hypovolemia Stimulates Compensatory Mechanisms • Baroreceptors • Aoritc arch, carotid arteries, kidneys • Detect blood pressure changes • Stimulates the medulla oblongata • MO stimulates the SNS to release Epi/Norepi • Myogenic Control • Arterial Spams
Stroke Volume • The amount of blood pumped by one ventricle during a contraction (ml/beat) • SV=EDV-ESV • End Diastolic Volume • Volume of blood in ventricle before contraction • End Systolic Volume • Volume of blood in ventricle after contraction
CO= HR xSV Force of contraction Length of muscle fibers (Starling curve/law) due to venous return, influenced by skeletal muscle pump and respiratory pump Sympathetic activity (and adrenaline) venous constriction by sympathetic NS and Increased Ca2+ availability
Stroke Volume • Increase EDV • Increase Venous Return • Increase Contraction of Muscles • Skeletal muscle twitching • Increase Respiration Rate and Depth • Negative Intrathoracic Pressure • Afterload • The combined load of EDV and arterial resistance during ventricular contraction • The force necessary to push the blood out of the heart into the arteries
Stroke Volume • Decrease ESV • Increase Force of Contraction in Cardiac Muscle • Sympathetic Nervous System Input • Epi/Norepi bind to receptors to open Calcium gates on the sarcolemma and sarcoplasmic reticulum
Preload • The degree of myocardial stretch before contraction begins • This stretch represents the load placed on cardiac muscles before they contract • There is a relationship between stretch and force according to Drs. Frank and Starling
Frank/Starling Law • Stretching muscle aligns actin and myosin better to achieve a greater force of contraction • Increasing EDV will stretch ventricle • Ventricle have greater force of contraction • Decreases ESV and thereby increases SV • Increases CO and BP
Frank-Starling Law • SV α EDV • i.e., the heart pumps all the blood sent to it via venous return • Therefore, Venous Return = SV • Preload = the amount of load, or stretch of the myocardium before diastole • Afterload = Arterial resistance and EDV combined • Ejection Fraction = % of EDV that is actually ejected; e.g., 70 ml/135ml x 100 = 52% at rest
Peripheral Resistance • Friction to flow against the walls of the arteries • Vasoconstrict the arteries by ½ the diameter and increase PR 4X • Laminar Flow
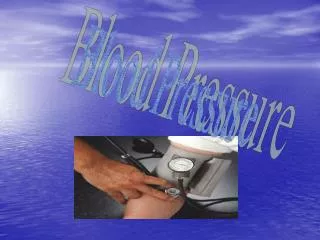
BP Estimated by Sphygmomanometry Auscultation of brachial artery with stethoscope in cubital fossa Based on effects oflaminar flow vs. turbulent flow
Blood Volume • Baroreceptors in the Kidney are stimulated due to low blood pressure • Renin and Angiotensinogen release • Angiotensin I • Angiotensin I is converted in the lungs to Angiotensin II by the enzyme Angiotensin Converting Enzyme (ACE) • ACE Inhibitors to reduce blood pressure
Blood Volume • Angiotensin II stimulates the Adrenal Cortex to release Aldosterone • Aldosterone is a Mineralcorticoid • Controls Na + /K + concentrations in the blood • Aldosterone stimulates the kidneys to retain Na + in the blood and excrete K+
Blood Volume • Increased concentration of Na + in the blood causes osmosis • Water moves from the intracellular and extracellular fluid into the blood stream • Increased concentration of Na in the blood stimulates Osmoreceptors in the Hypothalamus • Increased osmolarity or osmotic pressure in the blood • Anti-Diuretic Hormone Release • Decreased urine output • Unquenchable Thirst
Blood Viscosity • Typically takes 2 weeks to change viscosity • Kidney release Erythropoietin • Erythropoietin stimulates erythropoiesis in the red bone marrow • Increases RBC formation and thickness in the blood • Increases PR and BP
Mean Arterial Pressure Sometimes useful to have single value for driving pressure: Mean Arterial Pressure MAP CO x Rarterioles A Calculation: MAP = PD+ 1/3 (PS – PD ) MAP is influenced by CO Peripheral resistance (mostly at arterioles) ANS and endocrine Metabolic Needs Total blood volume Blood distribution
BP too low: Driving force for blood flow unable to overcome gravity O2 supply to brain Symptoms?
Shock Hypovolemic shock volume loss (dehydration, blood loss, burns) Distributive shock loss of vascular tone (anaphylactic, septic, toxic) Cardiogenic shock pump failure Dissociative shock (not in book) inability of RBC to deliver O2 (CO poisoning) Cell damage due to hypoxia Signs and symptoms? Management ? = generalized circulatory failure, may have a + feedback cycle
BP too high: Weakening of arterial walls lead to Aneurysms Risk of rupture & hemorrhage Cerebral hemorrhage Rupture of major artery
Pressures at which the Korotkoff . . . . . sound (= blood flow) first heard: . . . sound disappeared: CDAnimation Cardiovascular System: Measuring Blood Pressure
Slowly release pressure in cuff: turbulent flow