Download
1 / 47
490 likes | 761 Views
Differential Item Functioning. Laura Gibbons, PhD Thank you, Rich Jones, Frances Yang, and Paul Crane. Thank you, NIA.

E N D
Differential Item Functioning Laura Gibbons, PhD Thank you, Rich Jones, Frances Yang, and Paul Crane.
Thank you, NIA • Funding for this conference was made possible, in part by Grant R13AG030995-01A1 from the National Institute on Aging. The views expressed in written conference materials or publications and by speakers and moderators do not necessarily reflect the official policies of the Department of Health and Human Services; nor does mention by trade names, commercial practices, or organizations imply endorsement by the U.S. Government.
Thank you, Rich Many (most?) of these slides were adapted or copied directly from his presentations. Check out his 3-day workshop: http://www.hebrewseniorlife.org/latent-variable-methods-workshop
Outline • Why do we care about DIF? • A few notes about Item response theory • What is DIF? • How do we find DIF? • What do we do when we find DIF? • Does DIF matter?
We want unbiased tests • We want a test score to mean the same thing in all subgroups of people. • Test bias has been recognized as an issue for at least a century. • Missing a question based on a reference to a regatta may indicate race and/or SES, not intelligence.
Test bias came to the forefront in the 60’s, particularly with respect to race. • Many similar assumptions of a uniform culture turned out to be invalid. • Educational testing, intelligence testing, insurance licensing, firefighting • There hasn’t been a big political struggle for lack of bias in cognitive aging, measures of affect, but an important research concern none the less.
My favorite example of potential bias • Does endorsing the item “I cry easily” mean the same thing in women as in men?
Cognitive Tests • Cognitive test scores should represent cognition, not sex, race, test language, age, SES, etc. • True differences between groups in cognition exist. • However, the difference should not affect the relationship between a person’s cognitive test score and their true cognitive ability.
Key Ideas of IRT • Persons have a certain ability or trait • Items have characteristics • difficulty (how hard the item is) • discrimination (how well the item measures the ability) • (I won’t talk about guessing) • Person ability, and item characteristics are estimated simultaneously and expressed on unified metric • Interval-level measure of ability or trait. • This means that no matter what your ability level, a change of one point in the score represents an equivalent amount of change in ability. (NOT true for MMSE and most cognitive tests.)
Some Things Rich (and others)Can Do with IRT • Refine measures • Identify ‘biased’ test items • Adaptive testing • Handle missing data at the item level • Equate measures
Latent Ability / Trait • Symbolized with qi (or hi) • Assumed to be continuously, and often normally, distributed in the population • The more of the trait a person has, the more likely they are to ...whatever...(endorse the symptom, get the answer right etc.) • The latent trait is that unobservable, hypothetical construct presumed to be measured by the test (assumed to “cause” item responses)
Dimensionality • It matters whether or not the latent trait is unidimensional. • Knowing a person’s level on single underlying latent trait is sufficient to predict their likelihood of success on an item. • Item responses are dependent upon a person’s ability (and item characteristics) only. • Secondary factors are trivial. • There are methods that allow for departures from unidimensionality, but I won’t talk about them today.
Item Characteristic Curve • The fundamental conceptual unit of IRT • Relates item responses to the ability presumed to cause them • Represented with cumulative logistic or cumulative normal distributions • Here we illustrate with dichotomous items, for simplicity
Example of an Item Characteristic Curve 1.00 0.90 0.80 0.70 0.60 Probability of Correct Response 0.50 0.40 0.30 0.20 0.10 0.00 -3.0 -2.0 -1.0 0.0 1.0 2.0 3.0 Latent Ability Distribution Item Response Function P(yij=1|qi) = F[aj(qi-bj)]
Example of an Item Characteristic Curve 1.00 0.90 0.80 0.70 0.60 Probability of Correct Response 0.50 A Person with High Ability Has a High Probability of 0.40 Responding Correctly 0.30 0.20 0.10 0.00 -3.0 -2.0 -1.0 0.0 1.0 2.0 3.0 Latent Ability Distribution Example of an Item Characteristic Curve: High Ability
Example of an Item Characteristic Curve 1.00 0.90 0.80 0.70 0.60 Probability of Correct Response 0.50 0.40 0.30 A Person with Low Ability 0.20 Has a Low Probability of Responding Correctly 0.10 0.00 -3.0 -2.0 -1.0 0.0 1.0 2.0 3.0 Latent Ability Distribution Example of an Item Characteristic Curve: Low Ability
Example of an Item Characteristic Curve 1.00 0.90 0.80 0.70 0.60 Probability of Correct Response 0.50 Item Difficulty: The level of ability at which a person has 0.40 a 50% probability of responding correctly. 0.30 0.20 0.10 0.00 -3.0 -2.0 -1.0 0.0 1.0 2.0 3.0 Latent Ability Distribution Item Difficulty
1.00 0.90 0.80 0.70 0.60 0.50 0.40 0.30 Probability of a Correct Response 0.20 0.10 0.00 Latent Trait Density -3 -2 -1 0 1 2 3 Latent Trait Level Item and Person Ability are on the Same Metric
Example of Two ICCs that Differ in Difficulty 1.00 0.90 0.80 0.70 0.60 Probability of Correct Response 0.50 0.40 0.30 0.20 0.10 0.00 -3.0 -2.0 -1.0 0.0 1.0 2.0 3.0 Latent Ability Distribution
Example of an Item Characteristic Curve 1.00 0.90 0.80 0.70 0.60 Item Discrimination: Probability of Correct Response 0.50 How well the item separates persons of high and low ability; 0.40 Proportional to the slope of the ICC at the point of inflection 0.30 0.20 0.10 0.00 -3.0 -2.0 -1.0 0.0 1.0 2.0 3.0 Latent Ability Distribution Item Discrimination
Example of Two ICCs that Differ in Discrimination 1.00 0.90 0.80 0.70 0.60 Probability of Correct Response 0.50 0.40 0.30 0.20 0.10 0.00 -3.0 -2.0 -1.0 0.0 1.0 2.0 3.0 Latent Ability Distribution The Steeper Curve Has Greater Discrimination
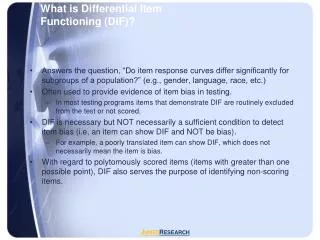
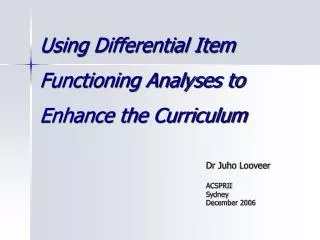
Identify Biased Test ItemsDifferential Item Functioning (DIF) • Differences in endorsing a given item may be due to • group differences in ability • item bias • both • IRT can parse this out • Item Bias = Differential Item Function + Rationale • Most IRT users identify DIF when two groups do not have the same ICC
DIF: When a demographic characteristic interferes with the relationship expected between a person’s ability level and responses to an item. • This is a conditional definition; we have to control for ability level, or else we can’t differentiate between DIF and differential test impact.
Here the overall levels differ, and there is also Uniform DIF
Chi-square • Educational testing still uses 2x2 tables and chi-squared tests. • Pros: conceptually and computationally easy • Cons: • Needs huge samples with adequate discordance. • Need to estimate ability and DIF in separate steps, potentially introducing bias. • Assumes ability is unidimensional.
Logistic Regression • Logistic regression, or ordinal logistic regression for ordinal items. • Uses the logistic link for the ICC curve equation: P(yij=1|qi) = F[aj(qi-bj)]
The 2 Parameter Logistic model • Logit P(Y=1|a,b,θ)=Da(θ-b) • Models probability that a person correctly responds to an item given the item parameters (a,b) and their person ability level θ • b is the item difficulty • When θ=b, 50% probability of getting the item correct • a is item discrimination • a determines slope around the point where θ=b • D is a constant
Logistic Regression • P(Y=1| θ)=f(β1 θ) • P(Y=1| θ, group)=f(β1 θ+β2*group) • P(Y=1| θ, group)=f(β1 θ +β2*group+β3* θ *group) • Uniform DIF: Compare models 1 and 2. • Non-Uniform DIF: Compare models 2 and 3.
Logistic Regression • Pros: • Handles fairly small samples. • Quick and easy if you’ve got Stata and Parscale, or R • Cons: • Need to estimate ability and DIF in separate steps, potentially introducing bias. • Assumes ability is unidimensional. • Need specific software.
Latent Variable Modeling • Single and 2-group MIMIC* models. • “We” use Mplus for this. • Compare the loadings and intercepts of the test items. * Multiple Indicators Multiple Causes
Latent Variable Modeling • Pros: • Simultaneous modeling of differences in ability and item-level performance • Capable of handling multidimensional constructs • Can use continuous variables for Uniform DIF • Cons: • Not precisely the IRT model • Modeling Non-Uniform DIF a challenge (Multiple Group models required) • Need specialized software.
Discard the item? • In educational settings, often items with DIF are discarded. • Unattractive option for us • Tests are too short as it is. • Lose variation and precision. • DIF doesn’t mean that the item doesn’t measure the underlying construct at all, just that it does so differently in different groups.
Better to account for the DIF • In logistic regression: • Constrain parameters for DIF-free items to be identical across groups • Estimate parameters for items found with DIF separately in appropriate groups • In latent variable modeling, it’s all one big model.
If we account for DIF, is the test unbiased? • We can only adjust for measured covariates. • Confounders such as education level may mean different things for different groups. • We may lack power or the data may be too sparse to account for all the DIF. • If most of the items on a test are biased, it’s hard to get anywhere.
DIF Impact • We find DIF in a lot of cognitive tests. • It’s important to assess the impact of items with DIF on the final score. • Often DIF in individual items favors one group in some items and the other group in others, the net result being a score that has little bias.
Good for the field, bad for my job security • So far, in my experience, cognitive scores accounting for DIF correlate very highly with the original IRT scores. • Even for DIF with respect to test language.
Here at Friday Harbor • How about depression scales? My workgroup will look. • Alden’s calibrated scores? Fascinating missing data question.
Despite what I said about usually finding minimal impact, DIF should be assessed as part of any test validation.