Download
1 / 31
320 likes | 543 Views
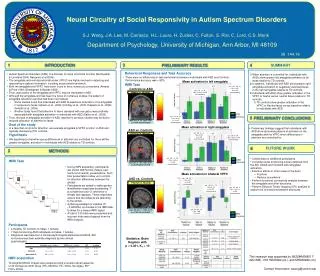
Atypical Visual Processing in Infant Siblings of Children with Autism Spectrum Disorders (ASD). Karen Dobkins Leslie Carver Joseph McCleery. Psychology Department University of California, San Diego. Funded by NAAR / Autism Speaks. & the M.I.N.D. Institute (UC Davis). TWO TYPE OF TESTS.

E N D
Atypical Visual Processing in Infant Siblings of Children with Autism Spectrum Disorders (ASD) Karen Dobkins Leslie Carver Joseph McCleery Psychology Department University of California, San Diego Funded by NAAR / Autism Speaks & the M.I.N.D. Institute (UC Davis)
TWO TYPE OF TESTS COGNITIVE/BEHAVIORAL ASSESSMENTS (6 - 36 months) Ages and Stages Questionnaire, MacArthur-Bates Communicative Development Inventory (CDI), Mullen Scales of Early Learning ASD Screening/Diagnogstics: M-CHAT, PDDST, ADOS, ADI 2) EXPERIMENTAL MEASURES A) Low-Level Visual Processing: 6 months A) Low-Level Visual Processing: 6 months B) Face Processing: 10 months B) Face Processing: 10 months C) Social Referencing: 18 months TWO ANALYSES: 1) ASD analysis: High-Risk, Affected vs. Unaffected 2) Endophenotype analysis: High-Risk vs. Controls 2) Endophenotype analysis: High-Risk vs. Controls
FACES OBJECTS OBJECTS 1) FACE PROCESSING PARADIGM: - Faces vs. Objects - Event Related Potentials (ERPs) Adults: Bentin et al., 1996. Infants: de Haan et al, 2002, Halit, et al, 2003, 2004; de Haan & Nelson, 1999
Amplitude (microvolts) - - Occipito-temporal cortex Face Component: N170 Averaged electrical response time-locked to repeated picture presentations
* Difference Scores N170 Latency (msec) Face Advantage N170 Latency Difference (Objects - Faces) F N170 Latency (msec) 0 0 N = 14 Object Advantage F N = 9 N = 14 N = 9 Study of Adults with ASD N170 Latency (msec) McPartland, Dawson, Webb, Panagiotides, Carver (2004)
10-month-olds High-Risk Infants Vs. Low-Risk Control Infants EEG Sensor Net Fast Application 124 Electrodes Electrical Geodesics, Inc.
Subjects 10 High-Risk infants Diagnosis of Their Older Sibling: - 5 Autistic Disorder - 1 Aspergers Syndrome - 4 PDD-NOS Controls: 20 Low-Risk infants Two Groups Matched: - gender, age, number of days born pre/post due date • overall cognitive development • Ages and Stages Questionnaire, MacArthur-Bates Communicative • Development Inventory (CDI), Mullen Scales of Early Learning
CCTV Camera Testing Set-up Speakers Stimulus Monitor
In adults: N170 In infants: N290 + P400 P400 N290 N170 Amplitude (microvolts) - -
N290 * p = 0.003 * p = 0.038 Face Advantage Mean Latency Difference (msec) (Objects - Faces) Mean Latency Difference (msec) (Objects - Faces) Object Advantage Controls (n = 20) High-Risk(n = 10) Latency Differences (Objects - Faces) P400
Let me know if you want to see: 1) RAW Latency Data for P400 and N290 2) Group difference for Amplitude of P400 and N290 3) Group differences in the effects of Familiarity
Our results in High-Risk 10-month-olds look like results from previous studies: Adults with ASD: McPartland et al. (2004) 2) Toddlers (3-4 yrs) with ASD: Webb et al. (2006) 3) Parents of Children w/ ASD: Dawson et al. (2005)
2) LOW-LEVEL VISUAL PROCESSING PARADIGM: - Subcortical Magnocellular (M) vs. Parvocellular (P) Pathway Processing - Visual Psychophysics - 6-month-olds A test of the hypothesis that atypicalities in face processing in ASD arise from abnormal development of the subcortical face processing pathway, i.e., the “amygdala” pathway (Schultz, 2005) ….. which originates in the M pathway
MAGNO = Luminance (Light/Dark) PARVO = Chromatic (Red/Green)
Forced-Choice Preferential Looking 6-month old infants
Subjects 13 High-Risk infants Diagnosis of Their Older Sibling: - 6 Autistic Disorder - 1 Aspergers Syndrome - 6 PDD-NOS Controls: 26 Low-Risk infants Two Groups Matched: - gender, age, number of days born pre/post due date • overall cognitive development
* p = 0.011 * p = 0.011 Log Difference Score (Lum - Chr) Log Contrast Sensitivity Controls (n = 26) High-Risk(n = 13) Magnocellular vs. Parvocellular Pathway Processing in 6 month olds
* p = 0.011 Log Difference Score (Lum - Chr) Log Contrast Sensitivity Controls (n = 26) High-Risk(n = 13) Magnocellular vs. Parvocellular Pathway Processing
Adults with ASD McPartland et al (2004) N170 3-4 year olds with ASD Webb et al (2006) N290 Parents of ASD Dawson et al (2005) N170 Latency Difference 10-month-old Infants P400 10-month-old Infants N290 Face Advantage Latency Difference (msec) (Objects - Faces) Latency Difference (msec) (Objects - Faces) Object Advantage
P400 N290 Latency Difference Latency Difference * p = 0.004 * p = 0.047 P400 Latency (msec) N290 Latency (msec) O F O F F F O O Controls (n = 20) High-Risk(n = 10)
Amplitude Differences (Faces - Objects) P400 N290 * p = 0.021 * p = 0.035 Face Advantage Mean Amplitude Difference (Faces - Objects) Mean Amplitude Difference (Faces - Objects) Object Advantage Controls (n = 20) High-Risk(n = 10) Very similar to children with ASD (Webb et al., 2006)
Familiarity Effects (N290) (Unfamiliar - Familiar) * MS Controls (n = 20) High-Risk(n = 10) Familiar Advantage Mean Latency Difference (Unfamiliar - Familiar) Unfamiliar Advantage
3-4 year olds with ASD Webb et al (2006) Face Advantage Latency Difference (Objects - Faces) Object Advantage Parents of Children with ASD Dawson et al (2005) Face Advantage Latency Difference (Objects - Faces) Object Advantage Adults with ASD McPartland et al (2004) Face Advantage Latency Difference (Objects - Faces) Object Advantage 60% scale
Stimuli FACES Familiar (mother) Unfamiliar (stranger) OBJECTS Familiar (favorite toy) Unfamiliar (novel toy) TODAY’S TALK: Data averaged over Familiar and Unfamiliar Data averaged over Right and Left Hemispheres
Single Trial Timeline Baseline (100 ms) Post-Stimulus (700 ms) Stimulus (500 ms) -100 0 1200 ms 500 ms Data Recording Continuous EEG, 250 Hz sampling Impedance: 80 kOhms 0.1 - 100 Hz bandpass filter Cz reference
Data Analysis 40 Hz low-pass filter Automated artifact rejection and individual trial inspection Data average over Occipito-Temporal electrodes (16 channels) TODAY’S TALK: Data averaged over RH and LH Replace up to 10 channels
Log(POSpost/NEGpost) - Log(POSpre/NEGpre) POS Toy Advantage P500 Latency Difference POS - NEG Toy (msec) Mean # References NEG Toy Advantage Controls (n = 23) High-Risk(n = 21) 3) SOCIAL REFERENCING PARADIGM: - Behavior & ERPs - 18-month-olds