Download
1 / 12
120 likes | 393 Views
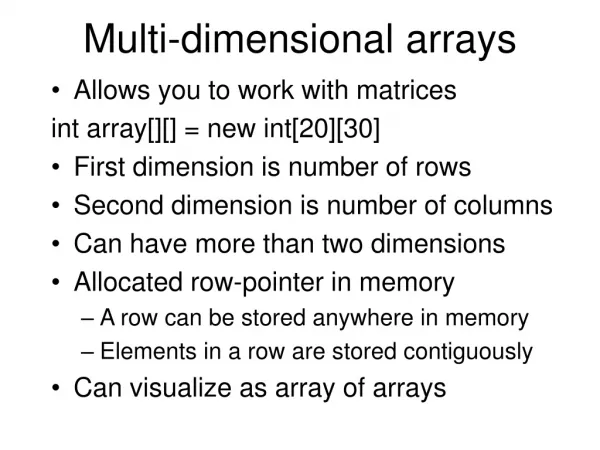
Multi-Dimensional Data Visualization. cs5984: Information Visualization Chris North. Data Space. Multi-dimensional: databases,… 1D: timelines,… 2D: maps,… 3D: volumes,… Hierarchies/Trees: directories,… Networks/Graphs: web, communications,…

E N D
Multi-Dimensional Data Visualization cs5984: Information Visualization Chris North
Data Space • Multi-dimensional: databases,… • 1D: timelines,… • 2D: maps,… • 3D: volumes,… • Hierarchies/Trees: directories,… • Networks/Graphs: web, communications,… • Document collections: digital libraries,…
Multi-dimensional • Fewer dimensions -> easier • 1,2,3-D scatterplots … • Cleveland’s rules • We will return to some more interesting 1,2,3-D cases later • What about many dimensional data? n-D …
Glyphs: Chernoff Faces • 10 Parameters: • Head Eccentricity • Eye Eccentricity • Pupil Size • Eyebrow Slope • Nose Size • Mouth Vertical Offset • Eye Spacing • Eye Size • Mouth Width • Mouth Openness • http://hesketh.com/schampeo/projects/Faces/chernoff.html
Multiple Views • Scatterplot Matrix • All pairs of attributes • Brushing and linking • http://noppa5.pc.helsinki.fi/koe/3d3.html
Today • Inselberg, “Multidimensional detective” (parallel coordinates), book p107 • margaret, josh s
Today • Kandogan, “Star Coordinates”, (web) • matt c, fanye
Assignment • Read for Thurs: • Rao, “Table Lens”, p343,597 (marty e, purvi) • Feiner, “Worlds within Worlds”, p96 (scott m, ajay) • Read for next Tues: • Tweedie&Spence, “Externalizing Abstract Mathematical Models” (Influence Explorer), p276 • Keim, “VisDB”, p126 • Read for next Thurs: • Fishkin, “Movable filters” (Magic Lens), p253 • Doan, “Query Previews”, web page • Send me your picture • Id #
Homework #1: Thurs Feb 1 • Get some data (>=1000 items, >=6 attributes) • Visualize it (>=2 tools) • Spotfire, Advizor, Table Lens, Parallel Coordinates, mmvz • Written report (2-3 pages) • data: • Usability – Rex hartson • eye-tracking - Debby hix • Biotech – lenny Heath, naren R • NASA - Layne watson • dept - Cliff Shaffer • univ - Dennis kafura • software eng - Steve Edwards • survey data - Jan lee