Download

1 / 65
650 likes | 808 Views
Wetland Ecosystem Services Protocol (WESP). -- A Short Course Halifax, NS August 13-15, 2013. Paul Adamus , Ph.D. Graduate Faculty, Water Resources Graduate Program Oregon State University and Adamus Resource Assessment, Inc. adamus7@comcast.net in collaboration with :

E N D
Wetland Ecosystem Services Protocol (WESP) -- A Short Course Halifax, NS August 13-15, 2013 Paul Adamus, Ph.D. Graduate Faculty, Water Resources Graduate Program Oregon State University and Adamus Resource Assessment, Inc. adamus7@comcast.net in collaboration with: Nova Scotia Environment – John Brazner
Tuesday 8:30 Introductions. Course logistics. Brief history of wetland assessment Definitions: wetland functions, values, and “health” (condition) How WESP works 10:15 BREAK Delimiting the assessment unit Definitions of tricky indicators 12:00 LUNCH 1:15 Fill out Office form for wetland #1 (together) 2:00 Visit wetland #1 and apply WESP 4:30 end Wednesday 8:30 Review scores from wetland #1 Lecture: Models for Hydrologic Functioning & Value Lecture: Models for Water Quality Functioning & Value 12:00 LUNCH 1:15 Fill out Office forms for wetland #2 and #3 2:00 Visit wetland #2 and apply WESP 4:30 end
Thursday 8:30 Visit and assess wetland #3 11:45 LUNCH 1:15 Review scores from wetlands #2 and #3 Lecture: Models for Habitat Functions & Values 2:30 BREAK Using WESP for estimating compensation – some options General discussion and feedback 4:30 end
One component of the approvals process: • Which wetlands are the most important? • What criteria should we use to tell? • How much information should we require? www.marcadamus.com
Why standardise the criteria & protocol? • Few people know all wetland functions. • Few people can instantly recall all function indicators. • Different people weight indicators differently for same function. • Reduce arbitrariness of assessments increased public confidence in results. • “Paper trail” useful for legal.
Definitions: • Delineating • Classifying • Scoring • Rating (Categorizing)
Delineation: Where’s the wetland boundary? • Surface Water + Vegetation YES • If No Surface Water, then: • soil indicators + plant indicators • (cannot determine only from aerials) Which of these are wetlands ?
Plants as Wetland Indicators – not just cattails, pondweeds, & willows! Most widespread among Southern Alberta wetlands: If Dominant = Wetland Field Sow-thistle Great Plantain Curly Dock Norwegian Cinquefoil Nuttall's Poverty-weed Oak-leaf Goosefoot Field Horsetail Crested Wheat Grass Graceful Cinquefoil Rough Bent Grass Stinging Nettle Short-beak Sedge Eastern Cottonwood Spiny-leaf Sow-thistle Miner's Pepperwort Kidney-leaf Buttercup Blite Goosefoot + 175 others! Wetland Dependents Baltic or Arctic Rush Foxtail Barley Silverweed Common Spikerush Water Smartweed American Wild Mint Broadleaf Cattail Woolly Sedge Reed Canary Grass Alkali Buttercup Wheat Sedge Fowl Blue Grass + 300 others! for full list see: WESPAB Biota file
Simplified Relationships of Wetland Functions to HYDROGEOMORPHIC CLASS
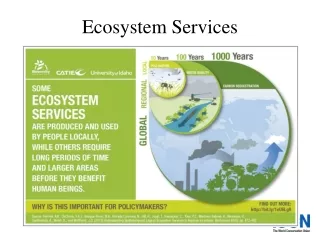
Functions: What wetlands do naturally. • Hydrologic functions • Water purification functions • Habitat functions • Benefits (“Values”):Does anybody care? (including non-humans) • examples: • Water Storage (function) Flood Control (benefit) • Denitrification (function) Water Purification (benefit) Functions and Benefits should be assessed independently of each other. Ecosystem Services = Functions+ Benefitsof those services
What Determines Benefits? Landscape Context Where do wetland functions prevent the most harm? Opportunity (upslope) Significance (downslope) Commodity Potential (timber, hay, etc.) Functional Interdependence Laws, Policies, and Public Preferences, e.g.: Endangered Species > Neotropical migrants > others ? Native species > Weeds (e.g., “wetland integrity”) ?
Biodiversity (e.g., wetland “health” or “integrity”) cannot predict all important ecosystem services. • “Healthy” wetlands do not necessarily provide more ecosystem services, e.g., water storage. • The levels of wetland functions do not always predict biodiversity or wetland health. • High-functioning wetlands often have low biodiversity. Biodiversity is better than ecosystem services for detecting wetland change, e.g., restoration progress. But estimating ecosystem services is necessary to address the “so what” question.
WESP: A spreadsheet with a suite of models for assessing 14 wetland ecosystem services at a site scale.
Data Inputs spreadsheet • Field observations (one-time visit, 135 indicators) • --Water regime • --Soils • --Vegetation (advanced ID skills not required) • --Potential human stressors • Landowner interview (when feasible) • Measurements of aerials (GoogleEarth) • Existing spatial data • Online maps & databases
Basic Procedure • Obtain aerial image and locate wetland. • Draw the AA boundary approximately. • Answer “office” (form OF) questions by interpreting aerial and by getting information from specified web sites. • Visit the wetland. • Walk around for several minutes. • Look for flood marks, non-native plants, etc. • Examine surface soil at 3 points. • Talk with landowner for relevant information, if possible. • Fill out forms F and S. • Adjust answers to form OF if warranted. • Enter data in the Excel spreadsheet. • Review resulting Scores and diagnose any that seem counterintuitive. • Submit results to agencies or organisations.
Uses of Outputs • PRIMARY: • Use scores as a partial basis for avoidance or compensation. • Identify ways to minimise impacts to functions of a wetland. • Identify wetland designs that may provide greatest levels of particular ecosystem services. • SUPPORTING: • Prioritise all wetlands in a rapidly developing watershed or region. • Monitor success of individual restoration projects.
Origins of WESPAB United States 1983, 1987 Oregon 2009, 2014 Alaska south 2011, 2013 • Pending? • British Columbia (southwest) • Nova Scotia
Data needs for optimally determining wetland functions Data needs for optimally determining wetland benefits
Validation. The process by which models or indicators are tested • relative to a pre-specified performance standard or objective. • repeatability. The reproducibility or replicability of a method as demonstrated by the consistency (precision) of its results among independent users and across time. • sensitivity. The ability to discriminate finely among alternative conditions or gradations of an attribute across a specified range of conditions, i.e., its responsiveness. • accuracy. The degree to which something approaches reality. • “Reality” may be represented simply by independent judgments of experts, or by extensive and intensive robust measurements of a function or other attribute.
If a lake or reservoir (or any ponded water body) that adjoins a vegetated wetland is longer than 1 km, and its open water part is much wider than the width of the vegetated wetland along the shoreline, then: Delimit the AA to include the vegetated wetland plus only the portion of adjoining open water that is believed to be shallower than 2 m during annual low water. If that cannot be estimated, extend the AA outward into the lake a distance equal to about the average width of the wetland that is along its shoreline (measured perpendicular to the shore). If distinct units of vegetated wetland are located discontinuously along the shoreline: any two adjoining units separated by non-we tland can be combined if the distance separating them, measured parallel to shore, is less than the length of the larger of the two vegetated wetlands, measured parallel to shore.
Assessing All Wetlands Along a Corridor or in a Town/Watershed (e.g., for prioritisation, and assuming all have been mapped) 1. Use GIS to compile existing spatial data relevant to functional assessment, e.g., LLWW. Also interpret aerials for all wetlands and fill out form OF. Compile into one Excel table. 2. Perform Cluster Analysis using statistical software to identify semi-homogeneous groups of wetlands. (or if that’s not possible, then sort the columns in the table to identify groups). Assign every wetland to a group. 3. Visit and assess at least 1 wetland per cluster. Try to achieve spatial balance, too (e.g., at least 1 wetland per subwatershed). 4. Preferably, assess more wetlands per cluster if WESP scores show more variation among those within a cluster than among clusters.
Key Terms As Defined by WESP Surface Water Groundwater Bordering Waters Open Water Ponded Water Upland Unmanaged Cover Herbaceous (Herbs) Forbs Emergents Sedges Moss meters “uphill from” “predominant” vs. “most”
Indicators of HIGH water(= upper limit of Seasonally Inundated zone) Water marks on trees (moss); water-stained leaves; algae amid grass stems Drift lines of debris on ground or suspended in shrubs Scoured areas on the soil surface Fresh deposits of water-borne sediment Height of outlet or berm relative to current water level Aquatic bed plants without water beneath (stranded) Airphoto sequence Indicators of LOW water (= lower limit of Seasonally Inundated zone) (= upper limit of Permanently Inundated zone) Minimal vegetation (all Obligates). No woody. Topography Airphoto sequence
Shoreline Edge Slope Slope from Disturbed Lands
Summary of WESPAB Features: • Collect data in a single visit of <2 hours. • High consistency: independent testing (Oregon version) showed repeatability of function scores (not indicators) is better than +/- 1 point on 0-10 scale. • Peer reviewed models: experts from DUC, AESRD, others. • Metrics and models well-documented by citation of the newest technical literature. • Calculations are automatic and explained simply in Manual. • Automatically places scores in the context of scores from ~150 other southern Alberta wetlands. • Separates wetland benefits from functions. Distinguishes wetland functions from wetland integrity. • Available July 2013.
Designing good methods isn’t just science … it’s architecture. • … the art of designing a method that gets you the information you’re really seeking. • (1) BPJ approach (open-ended questions): • Is the water regime optimal to support turtles? • (2) A more standardized approach: • Is most of the wetland 1-3 m deep? • (3) A qualified standardized approach: • spatially-qualified: • Are depths of at least 1m present in >50% of the unshaded portion of the wetland? • temporally-qualified: • Is the above present during most of the period, March-July?
Valued Hydrologic Functions • Ground Water Discharge (up) • Ground Water Recharge (down) • Storage & Desynchronization • (Reduction of Downstream Flood Peaks) • Low Flow Maintenance (sponge)
Types of Water Sources that Sustain Wetlands from: Brinson 1993
Focus: Ground Water from: Smith et al. 1995
Aquifer Flow and Oasis/ Wetland Formation: courtesy Pennsylvania State University