Download
1 / 13
130 likes | 140 Views
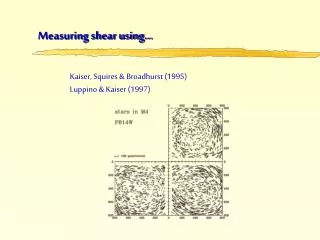
MEASURING ACCESSIBILITY USING GIS. Rui Pedro Julião Department of Geography and Regional Planning New University of Lisbon GeoComputation‘99. INTRODUCTION. Accessibility is a key issue Traditional evaluation methods don’t consider a real spatial model

E N D
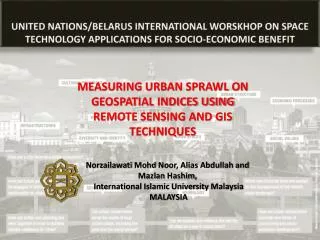
MEASURING ACCESSIBILITYUSINGGIS Rui Pedro Julião Department of Geography and Regional Planning New University of Lisbon GeoComputation‘99
INTRODUCTION Accessibility is a key issue Traditional evaluation methods don’t consider a real spatial model Arc/Node logic versus Territorial logic Accessibility measurement Methodology Lisbon and Tagus Valley Region
STARTING ISSUES Graph Theory - Vector model Continuous surface - Raster model Geometry versus Analysis 3-step methodology: 1 - Data Acquisition and Integration 2 - Cost Surface Modelling 3 - Accessibility Analysis
DATA ACQUISITIONAND INTEGRATION Geographical information Line weeding Reclassification Road Category Level IP highway 41 IP 2 lane 21 IC highway 42 IC 2 lane 22 National Road 23 Regional Road 24 Municipal Road (former national) 25 Municipal Road 26
COST SURFACE MODELLING Road Average Cell Crossing Category Speed Time(min) IP highway 110 0.0545 IP 2 lane 80 0.0750 IC highway 110 0.0545 IC 2 lane 70 0.0857 National Road 60 0.1000 Regional Road 55 0.1091 Municipal Road (former national) 50 0.1200 Municipal Road 50 0.1200 Off-road 6 1.0000 2 cost surfaces: • With highways • Without highways CCT – Cell Crossing Time (min) P – Pixel Size (m) TS – Travelling Speed (Km/h) Considering a 2-lane IP: 6 Km/h outside the road network CCT = 1 minute
ACCESSIBILITY ANALYSIS COST SURFACE ORIGIN COST DISTANCE FUNCTION ACCESSIBILITY SURFACE ALLOCATION
ACCESSIBILITYTO THE HEAD OF MUNICIPALITY Cost surface calculation without considering the highway network.
ANALYSISWORKFLOW Accessibility to head of municipality and territorial allocation based on a cost surface calculation without considering the highway network
TERRITORIALALLOCATION Which territory should belong to each municipality according to accessibility measurement
ACCESSIBILITYTO LISBON Considering highways and the other road network
ANALYSIS WORKFLOW 3-Step calculation: a) estimate the travelling time to each highway node; b) estimate the travelling time and territorial allocation for each highway node; c) add the travelling time from Lisbon to the node to its hinterland’s travelling time + evaluation of alternatives
CONCLUSIONS Accessibility as key issue for many different studies • Methodological basis for accessibility measurement • GIS enables a full and dynamic territorial coverage • Future developments: Traffic data / Vehicle data Barriers Urban network data Population density Land use / Land cover