Download

1 / 21
210 likes | 309 Views
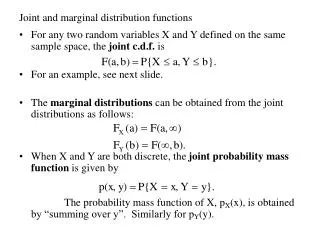
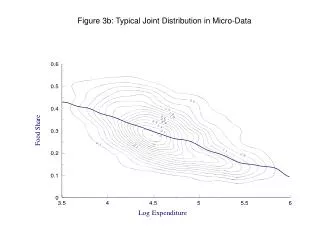
Figure 3b: Typical Joint Distribution in Micro-Data. Fig 3a: The Density of Log Consumption: FES. Fig 3c: Shape Invariant Engel Curve: Food Share. Fig 3d: Shape Invariant Engel Curve: Alcohol Share. Figure 10a: US Gasoline Demand: Conditional Mean for Upper Quartile of Income.

E N D
Figure 10a: US Gasoline Demand: Conditional Mean for Upper Quartile of Income Blundell, Horowitz and Parey (2008)
Figure 10a: US Gasoline Demand: Conditional Mean for Median Income Blundell, Horowitz and Parey (2008)
Figure 10a: US Gasoline Demand: Conditional Mean for 25% Income Blundell, Horowitz and Parey (2008)
Figure 8c: DWL as a % of Tax Paid Blundell, Horowitz and Parey (2008)
Figure 13a Median Gasoline Demand at Median Income Blundell, Horowitz and Parey (2009)
Figure 13b Median Gasoline Demand at 75% Income Blundell, Horowitz and Parey (2009)
Figure 13d Gasoline Demand Quantiles at Median Income Blundell, Horowitz and Parey (2009)
Figure 13e Gasoline Demand Quantiles at Median Income Blundell, Horowitz and Parey (2009)
Figure 8b: Nonparametric Exogeneity Test, By Income Blundell, Horowitz and Parey (2008)
Impact on budget share of an additional hour worked Conditional on income and prices Source: QUAIDS on UK FES, MR1
Effect of base broadening reform with earnings tax reform compensation, by expenditure decile
Effect of base broadening reform with earnings tax instruments as compensation (MRII), by income decile
Reform revenue neutral and designed to leave effective tax rates on earnings unchanged EMTR: before and after indirect tax reform
Reform revenue neutral and designed to leave effective tax rates on earnings unchanged PTR: before and after indirect tax reform
Welfare gains - Distribution of EV/x by ln(x) ln x Source: MRII