Download
1 / 19
190 likes | 354 Views
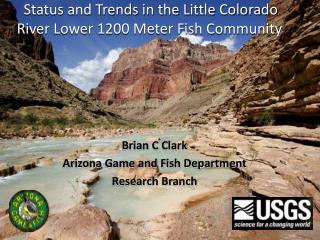
Annual and seasonal changes in fish presence in the lower Penobscot River 2010-2013. Garrett Staines and Gayle Zydlewski University of Maine, School of Marine Sciences. Open Rivers Initiative. Acknowledgements: Patrick Erbland data collection Megan Altenritter fieldwork

E N D
Annual and seasonal changes in fish presence in the lower Penobscot River 2010-2013 Garrett Staines and Gayle Zydlewski University of Maine, School of Marine Sciences Open Rivers Initiative Acknowledgements: Patrick Erblanddata collection Megan Altenritter fieldwork Rachel Kocikdata processing Haixue Shen data processing
Objective Create metric for seasonal and annual comparisons
Fisheries Acoustics Non-invasive with large spatial and temporal coverage Some examples: • Roanoke River; American shad and striped bass (Hightower) • Kenai River; Chinook and sockeye salmon (Burwen) • Chandalar River; chum salmon (Daum) And the Penobscot et al.
Split-beam Echosounders “Fish tracks” for quantification transducer sound beam
Study Area Veazie Dam Site Hampden Brewer Verona Island
Sample Site Cross Section Coverage East West Cianbro Side Waterfront Side Mean Low-tide 180 m wide x 10 m deep 3 meter tidal flux
Data Collected JAN FEB MAR APR MAY JUN JUL AUG SEP OCT NOV DEC Waterfront 2010 Cianbro Waterfront 2011 Cianbro Waterfront 2012 Cianbro Waterfront 2013 Cianbro *some gaps from equipment malfunction
Current data subset • One side, limited sampling range, certain tidal and diel • Eight 15 minute files per month • Visual counts with subsamples; compare with tracking • Try several fish tracking parameters; choose best by year
Full Data Set Sub-set JAN FEB MAR APR MAY JUN JUL AUG SEP OCT NOV DEC JAN FEB MAR APR MAY JUN JUL AUG SEP OCT NOV DEC Waterfront 2010 Cianbro Waterfront Waterfront 2010 2011 Cianbro Cianbro Waterfront 2012 Waterfront Cianbro 2011 Cianbro Waterfront 2013 Cianbro Waterfront 2012 Cianbro Cianbro, night, high slack tide only ~80 m Waterfront 2013 15 m Cianbro
Current data subset • Cianbro side with first 15 m range, night high slack tide • Eight 15 min files per month; May-Oct; 2010-2013 • Visual counts with subsamples; compare with tracking • Try several fish tracking parameters; choose best by year
Automated “Fish Tracks” Visual Handcount Fish Tracks
Current data subset • Cianbro side with first 15 m range, night high slack tide • Eight 15 min files per month; May-Oct; 2010-2013 • Visual counts with subsamples; compare with tracking • Try several fish tracking parameters; choose best by year
Gauge Height (m) Fish Density May Jun Jul Aug Sep Oct Nov Date
* Fish Density May Jun Jul Aug Sep Oct Month
Summary: Biological Implications • Peak in May (except 2010; start of gear deployment) • Decrease in density through summer • Density spike at beginning of Fall (except 2013; gear malfunctions) • Daily/weekly increases in density follow increases in gauge height • Used as baseline for dam removal Thoughts/Questions: Biological Implications
Future • Continued sampling • Additional subsets of ebbing and flooding tides • Additional range added to analysis • Minimum subset requirements for acceptable precision • *doubled sub-sample in 2010