Download
1 / 21
210 likes | 363 Views
Problem Set I: Review. Intro, Measures of Central Tendency & Variability, Z-scores and the Normal Distribution, Correlation, and Regression. QUESTION 1: Short answer: What is a statistic? Give a definition and an example. Explain how the example illustrates the definition you have provided.

E N D
Problem Set I: Review Intro, Measures of Central Tendency & Variability, Z-scores and the Normal Distribution, Correlation, and Regression
QUESTION 1: Short answer: What is a statistic? Give a definition and an example. Explain how the example illustrates the definition you have provided. A statistic is a number that organizes, summarizes, and makes understandable a collection of data. An example of a statistic is the mean. The mean is a single number calculated on a set of data which gives an idea of the collection of values without having to report them all individually.
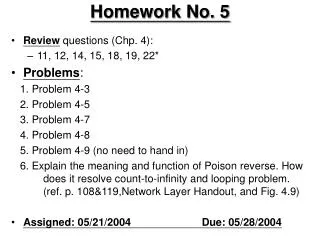
QUESTION 2: A psychologist interested in the dating habits of undergraduates in the Psychology major samples 10 students and determines the number of dates they have had in the last six months. He knows that the mean number of dates is 7.8, and the sum of squares (SS) is 223.2. Assume a normal distribution. In order to make ANY conclusions about proportions, we need to use the z-table. _ To use z-scores, we need the mean (x) and standard deviation (s). = 7.8 _ s = 4.98 x • What percentage of all undergraduate students went on less than 4 dates in the last six months? • If the psychologist had 10 students total, approximately how many of these students went on between 8 and 13 dates in the last six months? After shading in the distribution, it’s clear that “less than 4 dates” refers to an AREA C Turn 4 into a z-score: (4-7.8)/4.98 = -.76 The AREA C for z= .76 is .2236, or 22.36%
QUESTION 2: A psychologist interested in the dating habits of undergraduates in the Psychology major samples 10 students and determines the number of dates they have had in the last six months. He knows that the mean number of dates is 7.8, and the sum of squares (SS) is 223.2. Assume a normal distribution. In order to make ANY conclusions about proportions, we need to use the z-table. _ To use z-scores, we need the mean (x) and standard deviation (s). = 7.8 _ s = 4.98 x • What percentage of all undergraduate students went on less than 4 dates in the last six months? • If the psychologist had 10 students total, approximately how many of these students went on between 8 and 13 dates in the last six months? After shading in the distribution, it’s clear that “less than 4 dates” refers to an AREA C Turn 4 into a z-score: (4-7.8)/4.98 = -.76 The AREA C for z= .76 is .2236, or 22.36% After shading in the distribution, it’s clear that “between 8 and 13” refers to an portion of the distribution which we can only find by combining areas from the table. The AREA B for z= 1.04 is .3508 Turn 13 into a z-score: (13-7.8)/4.98 = 1.04 Turn 8 into a z-score: (8-7.8)/4.98 = .04 The AREA B for z= .04 is .0160 .3508 - .0160 = .3348 and so 10(.3348) = 3.35 students (approximately 3)
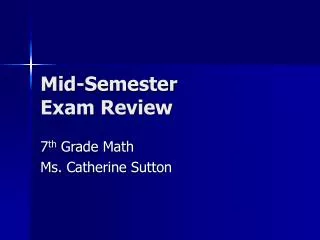
QUESTION 2: A psychologist interested in the dating habits of undergraduates in the Psychology major samples 10 students and determines the number of dates they have had in the last six months. He knows that the mean number of dates is 7.8, and the sum of squares (SS) is 223.2. Assume a normal distribution. In order to make ANY conclusions about proportions, we need to use the z-table. _ To use z-scores, we need the mean (x) and standard deviation (s). = 7.8 _ s = 4.98 x • C. What is the number of dates one must have gone on in the last six months in order to be in the top 2.5%? _ x After shading in the distribution, it’s clear that the top 2.5% is in the right tail of the distribution, and extends from some z-score and beyond (this means it’s an AREA C). We need the z-score which has an AREA C closest to .0250 without going over. We find an AREA C which is EXACTLY .0250 for a z-score of 1.96. We need to turn this into a raw score, in other words, a number of dates. + z(s) Raw Score = Raw Score = 7.8 + 1.96(4.98) Raw Score = 7.8 + 9.76 Raw Score = 17.56 dates
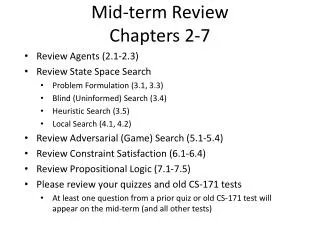
Raw Score Method QUESTION 3: A researcher in a learning laboratory believes that the amount of water a rat drinks before entering a maze will affect how well the rat performs in the maze. He records the amount of water consumed by each of his 4 rats (in ounces) and then puts them each into a maze and records how long it takes each rat to complete the maze (in seconds). He then calculates the correlation coefficient between these two variables, which is .48. His data can be found below: • As practice, find the correlation coefficient of this data by hand. Confirm that it does indeed come out to be .48. • Write out the equation of the regression line for predicting maze performance from amount of water consumed.
QUESTION 3: A researcher in a learning laboratory believes that the amount of water a rat drinks before entering a maze will affect how well the rat performs in the maze. He records the amount of water consumed by each of his 4 rats (in ounces) and then puts them each into a maze and records how long it takes each rat to complete the maze (in seconds). He then calculates the correlation coefficient between these two variables, which is .48. His data can be found below: • As practice, find the correlation coefficient of this data by hand. Confirm that it does indeed come out to be .48. • Write out the equation of the regression line for predicting maze performance from amount of water consumed.
Z-score Method QUESTION 3: A researcher in a learning laboratory believes that the amount of water a rat drinks before entering a maze will affect how well the rat performs in the maze. He records the amount of water consumed by each of his 4 rats (in ounces) and then puts them each into a maze and records how long it takes each rat to complete the maze (in seconds). He then calculates the correlation coefficient between these two variables, which is .48. His data can be found below: • As practice, find the correlation coefficient of this data by hand. Confirm that it does indeed come out to be .48. • Write out the equation of the regression line for predicting maze performance from amount of water consumed.
QUESTION 3: A researcher in a learning laboratory believes that the amount of water a rat drinks before entering a maze will affect how well the rat performs in the maze. He records the amount of water consumed by each of his 4 rats (in ounces) and then puts them each into a maze and records how long it takes each rat to complete the maze (in seconds). He then calculates the correlation coefficient between these two variables, which is .48. His data can be found below: • As practice, find the correlation coefficient of this data by hand. Confirm that it does indeed come out to be .48. • Write out the equation of the regression line for predicting maze performance from amount of water consumed. _ _ y = .67x + 8.16 b = r(sy/sx) a = y – bx a = 10.50 -.67(3.50) b = .48(3.70/2.65) a = 8.16 b = .67
QUESTION 3: A researcher in a learning laboratory believes that the amount of water a rat drinks before entering a maze will affect how well the rat performs in the maze. He records the amount of water consumed by each of his 4 rats (in ounces) and then puts them each into a maze and records how long it takes each rat to complete the maze (in seconds). He then calculates the correlation coefficient between these two variables, which is .48. His data can be found below: • Make a prediction of how long it would take a rat that drank 10oz of water to complete this maze. • Write out the equation of the regression line to predict amount of water consumed from time spent to complete the maze. y = .67x + 8.16 y = .67(10) + 8.16 y = 14.86 seconds _ _ y = .34x - .07 b = r(sy/sx) a = y – bx a = 3.50 -.34(10.50) b = .48(2.65/3.70) a = -.07 b = .34
QUESTION 3: A researcher in a learning laboratory believes that the amount of water a rat drinks before entering a maze will affect how well the rat performs in the maze. He records the amount of water consumed by each of his 4 rats (in ounces) and then puts them each into a maze and records how long it takes each rat to complete the maze (in seconds). He then calculates the correlation coefficient between these two variables, which is .48. His data can be found below: • What kind of relationship exists between water consumption and maze completion speed? Is it better for the rats to have consumed a lot of water prior to entering the maze, or does it hinder their performance? • Calculate the coefficient of determination. What does this value tell you about how well you are or are not able to make an accurate prediction using this regression line. Since there is a positive moderate correlation between water consumption and maze completion, it implies that the more water a rat drinks, the longer it takes to complete the maze. It seems as though it’s better for the rats not to consume a lot of water so their completion time is quicker. r-squared is (.48)(.48) = .2304, which means there is only 23% of completion time accounted for by water consumed. This is a small amount of variation, telling us perhaps our prediction is not very accurate.
QUESTION 4: Below is a sample of scores on a new version of an IQ test. The range of possible points on this test is 0-100. • Calculate the mean, standard deviation, and variance of these scores. (do this by hand, show your work) • What is the z-score obtained by Julia, and what does this z-score tell us about her grade? Mean = Sx/N Sx = 383 383/5 = 76.6 Raw score method: Sx Sx2
QUESTION 4: Below is a sample of scores on a new version of an IQ test. The range of possible points on this test is 0-100. • Calculate the mean, standard deviation, and variance of these scores. (do this by hand, show your work) • What is the z-score obtained by Julia, and what does this z-score tell us about her grade? Mean = Sx/N Sx = 383 383/5 = 76.6 Deviation Method: _ S(x-x)2 aka SS z = (65-76.6)/19.82 _ z = -.59 z = (x-x)/s Julia’s z-score is negative, indicating she performed worse than average, and specifically .59 standard deviations below average.
QUESTION 4: Below is a sample of scores on a new version of an IQ test. The range of possible points on this test is 0-100. Suppose you want to know if this IQ test is in any way related to the old IQ test, so you administer a version of the old test to each of these individuals. The following are their scores on the old IQ test: • C. Is there a relationship between the scores on the old test and the scores on the new test? In other words, does the new test seem to be measuring IQ in the same way? Describe the relationship.
Raw Score Method QUESTION 4: Below is a sample of scores on a new version of an IQ test. The range of possible points on this test is 0-100. Suppose you want to know if this IQ test is in any way related to the old IQ test, so you administer a version of the old test to each of these individuals. The following are their scores on the old IQ test: • C. Is there a relationship between the scores on the old test and the scores on the new test? In other words, does the new test seem to be measuring IQ in the same way? Describe the relationship.
QUESTION 4: Below is a sample of scores on a new version of an IQ test. The range of possible points on this test is 0-100. Suppose you want to know if this IQ test is in any way related to the old IQ test, so you administer a version of the old test to each of these individuals. The following are their scores on the old IQ test: • C. Is there a relationship between the scores on the old test and the scores on the new test? In other words, does the new test seem to be measuring IQ in the same way? Describe the relationship. Yes, there is a strong positive correlation between the two versions of the test. The higher the score on the old version, the higher the score on the new version, thus it seems that the two tests are measuring IQ the same way.
The Mean QUESTION 5: Over the years, my students have informed me that they feel as though I seem to grade paper assignments according to their length. To assess this relationship, I decide to perform a correlational analysis on the number of pages of 12 papers and the grades I assigned to them. I find that the correlation coefficient (r ) is -.90. The following is also known: Page length x y Grade 7.42 80.92 Mean s Suppose a student had access to this information and wanted to predict their grade for an upcoming paper. Their paper is 3 pages long. • Write out the equation of the regression line to predict grade from paper length. • Predict the grade for this student whose paper is 3 pages long. • If someone received a grade of 100 on their paper, predict the number of pages of their paper (this will involve multiple steps; ie find the equation of the regression line first, then plug in to make a prediction).
QUESTION 5: Over the years, my students have informed me that they feel as though I seem to grade paper assignments according to their length. To assess this relationship, I decide to perform a correlational analysis on the number of pages of 12 papers and the grades I assigned to them. I find that the correlation coefficient (r ) is -.90. The following is also known: Standard Deviation (s) We know that… x y and 7.42 80.92 Mean Page length Grade s 3.63 10.21 Suppose a student had access to this information and wanted to predict their grade for an upcoming paper. Their paper is 3 pages long. • Write out the equation of the regression line to predict grade from paper length. • Predict the grade for this student whose paper is 3 pages long. • If someone received a grade of 100 on their paper, predict the number of pages of their paper (this will involve multiple steps; ie find the equation of the regression line first, then plug in to make a prediction).
QUESTION 5: Over the years, my students have informed me that they feel as though I seem to grade paper assignments according to their length. To assess this relationship, I decide to perform a correlational analysis on the number of pages of 12 papers and the grades I assigned to them. I find that the correlation coefficient (r ) is -.90. The following is also known: x y 7.42 80.92 Mean s 3.63 10.21 Suppose a student had access to this information and wanted to predict their grade for an upcoming paper. Their paper is 3 pages long. • Write out the equation of the regression line to predict grade from paper length. • Predict the grade for this student whose paper is 3 pages long. • If someone received a grade of 100 on their paper, predict the number of pages of their paper (this will involve multiple steps; ie find the equation of the regression line first, then plug in to make a prediction). _ _ b = r(sy/sx) a = y - bx y = -2.53x + 99.69 b = -.90(10.21/3.63) a = 80.92 – (-2.53(7.42)) b =-2.53 a = 99.69 = 92.1 y = -2.53(3) + 99.69
QUESTION 5: Over the years, my students have informed me that they feel as though I seem to grade paper assignments according to their length. To assess this relationship, I decide to perform a correlational analysis on the number of pages of 12 papers and the grades I assigned to them. I find that the correlation coefficient (r ) is -.90. The following is also known: y x 7.42 80.92 Mean s 3.63 10.21 • C. If someone received a grade of 100 on their paper, predict the number of pages of their paper (this will involve multiple steps; ie find the equation of the regression line first, then plug in to make a prediction). _ _ b = r(sy/sx) a = y - bx b = -.90(3.63/10.21) a = 7.42 – (-.32(80.92)) b = -.32 a = 33.30 y = -.32x + 33.30 = 1.31 pages y = -.32(100) + 33.30
QUESTION 6: You are collecting IQ data from a sample of 20 of your classmates. You record the following IQ scores: IQ = {120, 110, 120, 100, 120, 130, 100, 110, 130, 120, 80, 140, 110, 90, 70, 120, 120, 110, 130, 140} • Describe the shape of the distribution of IQ scores. • Find the Mean, Median, and Mode. Use these values to support your judgment of the distribution’s shape in part A. The distribution is negatively skewed and unimodal. The mean of this distribution is 113.5, median and mode are both 120. The fact that the mean is smaller than the median supports the conclusion that the distribution is negatively skewed.