Download
1 / 18
180 likes | 390 Views
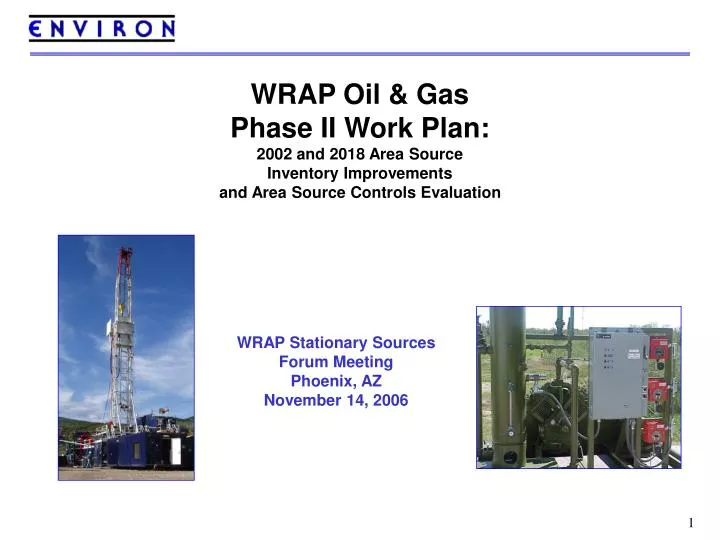
WRAP Oil & Gas Phase II Work Plan: 2002 and 2018 Area Source Inventory Improvements and Area Source Controls Evaluation. WRAP Stationary Sources Forum Meeting Phoenix, AZ November 14, 2006. Work Plan Tasks Overview. 3 major tasks in the Phase II work plan, 2 optional additional tasks:.

E N D
WRAP Oil & GasPhase II Work Plan:2002 and 2018 Area SourceInventory Improvementsand Area Source Controls Evaluation WRAP Stationary Sources Forum Meeting Phoenix, AZ November 14, 2006
Work Plan Tasks Overview 3 major tasks in the Phase II work plan, 2 optional additional tasks: • 2002 WRAP Regional Emissions Inventory Update • Control Strategies Identification and Evaluation • 2018 Emissions Projections and Control Strategies Implementation • (Optional) Updating Baseline Emissions Inventory from 2002 → 2005 • (Optional) Updating 2018 SO2 Emissions Projections
Phase I Recap Changes in oil and gas NOx emissions in the 2002 inventory
Phase I Recap 2002 State total NOx emissions (tons) from oil and gas sources
Phase I Recap Phase I emissions estimated based on both well count and production • Drilling rig emissions based on well counts from state OGCs • Compressor emissions based on scale-up of Jonah-Pinedale information on production basis • VOC emissions based on well count for some activities, and on production for others • 2018 Projections based on combination of well count data from RMPs and production forecasts from the EIA
Task 1: 2002 Emissions Inventory • Major effort to update methodology for 2002 emissions inventory using information from producers • Update drilling rig emissions estimates • Update compressor engine emissions estimates • Examine potential for improvement of VOC emissions from venting, flaring and dehydrators • Update CBM engine emissions estimates • Examine potential for estimating fugitive dust emissions from O & G operations in the WRAP region • Subtasks (a) and (b) will be completed, subtasks (c) – (e) to be completed based on available resources
Task 1: 2002 Emissions Inventory • New methodology will estimate emissions on a basin-wide average basis for all basins in the WRAP region, focusing on those basins where major O&G activities are occurring and detailed producer information is available • In basins where significant activity is not occurring, or producer information is unavailable, will rely on Phase I estimates
Task 1: 2002 Emissions Inventory • Drilling Rig Emissions • Improve estimate of actual drilling time by formation and basin from producer information on drilling times (rather than spud date and well completion date) • Improve estimate of average drilling rig engine load by formation and basin • Determine average horsepower requirements by formation and basin and identify most often used or representative makes/models of drilling rig engines • Incorporate manufacturer’s rated emissions factors for makes/models identified, or producers’ emissions tests where available • Incorporate SO2 emissions factors (based on sulfur content of fuel) and PM emissions factors
Task 1: 2002 Emissions Inventory • Compressor Engine Emissions • Determine for each basin either (1) the average percentage of wells with wellhead, lateral and central compression or (2) percentage of total HP with wellhead, lateral or central compression • Remove all central and lateral compressors that have been counted in a point source inventory for each state • Determine for each basin a representative or most often used make/model of compressor, including HP and rated or tested emissions factors • Determine for each basin an average load factor for wellhead/lateral compressors • Basin-wide emissions estimate on the basis of total well count
Task 1: 2002 Emissions Inventory • VOC Emissions • Previous Work included: • Tanks-flashing, working and breathing losses (VOC) • Glycol dehydration units (VOC) • Heaters (VOC and NOx) • Pneumatic Devices (VOC) • Completion-venting and flaring (VOC, NOx, CO) • New work will look at VOC from: • Venting (from unloading fluids) • Fugitives (using typical well diagrams) • Dehydrators (look at point source vs. area source distribution)
Task 1: 2002 Emissions Inventory • CBM Engines • Basins with significant CBM activity will be addressed for drilling rig and compressor emissions in Tasks 1(a) and 1(b) • Estimate CBM pump engine emissions estimated based on producer information (e) Fugitive Dust Emissions • Explore feasibility of estimating fugitive dust emissions on the basis of annual vehicle activity, unpaved/paved road mileage in WRAP region and dust emissions characteristics • Evaluate other sources of information
Task 2: Control Strategies Table 3-1. Control technology evaluations to be conducted. 1 Development of Control Technology will depend on level of emissions 2 SOx emissions will be a function of the sulfur content of fuels
Task 2: Control Strategies • Use control strategies identified through other analyses including: • 4 Corners Air Quality Task Force (AQTF) • EPA Natural Gas Star Program • Colorado O&G Control Technology Analysis • Argonne National Lab’s Strategic Emissions Reduction Plan (SERP) • Develop white papers on control technologies that detail: • Control effectiveness • Cost • Potential emissions reduction • Cost-effectiveness ($/ton)
Task 3: 2018 Emission Projections • Re-evaluate projected well count data from RMPs and check older RMPs’ 2002 (or 2005) well count accuracy • Convert EIA production-based data to well count data by determining average production per well by basin • Determine projected percentage of well count with wellhead compression vs. lateral or central compression • Obtain information from producers, future forecasts, or state OGCs • Project to 2018 using 2002 (or 2005) base case and growth factors • Calculate range of projected emissions based on range of well counts or production – report both high and low cases
Task 3: 2018 Emission Projections • Recommend control strategy (-ies) from Task 2 in terms of feasibility, emissions reductions and cost-effectiveness • Incorporate control strategy (-ies) from Task 2 to determine range of potential reductions in 2018 inventory on a state-by-state basis • For basins in states outside areas of focus, apply control factors to inventory including a review of additional control technologies implemented since previous inventory and any control strategies “in the works”
Optional Task 4: Updated 2002 → 2005 Emissions • Objective is to update base year for projections from 2002 to 2005 using newly available state OGC data for 2005 • 2005 represents a more current base year for projections and can be used as a second “data point” to verify projections methodology • Methodology will be to first update 2002 emissions using the Phase II tasks described here, then to scale up 2002 data using 2005 OGC well count or production • In areas with no production or wells in 2002, but with production or wells in 2005 emissions would be scaled based on state average emissions per well (or per production unit)
Optional Task 5: 2018 Point Source SO2 Emissions • Objective is to revise Pechan report on 2018 SO2 emissions projections to incorporate ENVIRON projection methodology and producers’ information on growth forecasts and emissions controls • Identify major SO2 point source emissions sources in each state of interest • Obtain producer information on control strategy effectiveness, implementation rate, timetable and growth trends from 2002 – 2005 as well as for 2018 based on production forecasts • Conduct review of Title V Permits to determine emissions with and without control technologies • Revise estimates of 2018 emissions