Download
1 / 44
450 likes | 723 Views
Epidemiology and Applied Statistics Review Module 1 – Intro to Epidemiology & Measures of Disease. American College of Veterinary Preventive Medicine Review Course Katherine Feldman, DVM, MPH, DACVPM kfeldman@umd.edu 301-314-6820. Plan. Students review modules on their own

E N D
Epidemiology and Applied Statistics Review Module 1 – Intro to Epidemiology & Measures of Disease American College of Veterinary Preventive Medicine Review Course Katherine Feldman, DVM, MPH, DACVPM kfeldman@umd.edu 301-314-6820
Plan • Students review modules on their own • Send questions by email to Katherine Feldman (kfeldman@umd.edu) by Friday March 23 a.m. • Conference call Friday March 23 2-3 p.m. • Watch email and Blackboard for conference call details
References • Gordis L. Epidemiology, 3rd ed. Elsevier Saunders, Philadelphia, 2004. • $47.95 from Amazon.com • Norman GR, Streiner DL. PDQ statistics, 3rd ed. BC Decker Inc., Hamilton, 2003. • $17.79 from Amazon.com
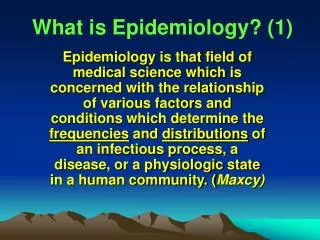
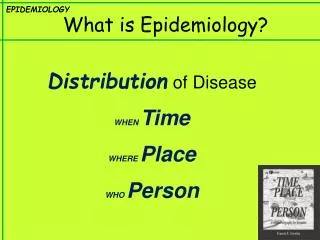
What is Epidemiology? • From Greek • Epi (among, upon) • Demos (the people) • Logos (knowledge, doctrine) • Many, many definitions • The study of the distribution and determinants of health-related states or events in specified populations, and the application of this study to the control of health problems • Last, Dictionary of Epidemiology
Goals of Epidemiology • Elaboration of causes that explain patterns of disease occurrence • Determine extent of disease • Study natural history of disease • To promote, protect and restore health • Provide foundation for developing public policy and regulatory decisions
Typical Epidemiologic Approach • Determine existence and magnitude of problem • Describe who has the problem (animal/person, place, time) • Develop hypotheses about why problem is happening • Test the hypotheses using appropriate study designs and statistical tests • Develop interventions based on findings • Evaluate effectiveness of interventions
Basic Tenet of Epidemiology • Disease does not occur randomly in a population • Disease occurrence is related to environment of species being studied • Environment includes physical, biological, sociological, meteorological, & management characteristics
Host Vector Environment Agent Epidemiologic Triad • Disease is result of forces within a dynamic interaction between • Agent • Host • Environment
Ratios • An expression of the relationship of 2 quantities • Numerator is not in the denominator • With a dimension • # of dogs owned / 100,000 population • Without a dimension • # 2nd year vet students / # 3rd yr vet students
Proportions • Ratio in which numerator is contained in the denominator • Dimensionless • Ranges from 0 – 1 • Tells us what fraction of population is affected # vets sitting ACVPM exam Total # vets
Rates • Ratio in which there is a relationship between the numerator and the denominator • A true rate is instantaneous change in one quantity per unit change in another • Tells us how fast disease occurs in a population • # tests taken in vet curriculum person-years in vet curriculum
Measures of Morbidity: Prevalence • Prevalence (point prevalence, prevalence rate) • Proportion of pop’n with disease at a specific time # of subjects with disease at a point in time Population at the same point in time • Period prevalence • Frequency of disease for a given time interval # of subjects with disease for given time interval Population at mid-interval
Measures of Morbidity: Incidence • Cumulative incidence, incidence proportion • Proportion of subjects who develop disease during a certain time period • Unitless, interpret in the context of time period • Measure of average risk for a population # events during a period of time Population without disease at beginning of period
Measures of Morbidity: Incidence • Incidence rate, incidence density • Occurrence of new event per unit time • The numerical value has no interpretability because it depends on the arbitrary selection of the time unit # new events Total person-time at risk in population
Measures of Morbidity: Incidence • Attack rate • Cumulative incidence used for particular populations observed for limited periods of time, as in an outbreak • Usually expressed as a percent # events of dz during epidemic time period Population at risk at start of period
Prevalence & Incidence: Example A veterinarian investigates a disease that runs a clinical course ending in either recovery or death in a herd of cattle. On July 1, 2003 the herd is investigated when the disease is already present. The herd is then observed for the following year, during which period there are no additions and all animals are followed up.
Prevalence & Incidence: Example Total herd size, July 1 2003 600 Total number ill, July 1 2003 20 Total number developing disease 80 July 1 2003-July 1 2004 Prevalence on July 1 2003 = 20/600 = 0.03 Cumulative incidence July 1 2003 - July 1 2004 = 80/580 = 0.14 Incidence rate = 80 / {(580 + 500) / 2} = 0.15 per animal-year at risk
Prevalence, Incidence & Duration • Prevalence is not a measure of risk • Does not take into account the duration of the disease • If prevalence (P) is small and incidence rate (I) and duration (D) are constant over time then P ≈ I x D
Measures of Mortality • Mortality rate Total # deaths from all causes in 1 year Population at mid-year • Disease-specific mortality rate Total # deaths from specific dz in 1 year Population at mid-year
Measures of Mortality • Case-Fatality Rate (CFR) # deaths after dz onset or diagnosis # individuals with the dz • Proportionate Mortality # deaths from specific dz in time period Total # deaths in that time period
Measures of Mortality: Example • Population of 100,000 • 20 are sick with disease X • In 1 year • 18 of 20 die from disease X • 1000 die of other causes
Measures of Mortality: Example Mortality rate = 1018/100,000 = 1.018% Mortality rate from dz X = 18/100,000 = 0.018% CFR as a result of dz X = 18/20 = 90% Proportionate mortality = 18/1018 = 1.77%
Mortality • Can indicate severity of disease and also be an index of the risk of disease • If a disease is not typically fatal, mortality is not a good index of incidence • E.g., West Nile virus • When the case fatality rate is high and duration of disease is short, mortality is good reflection of risk • E.g., Rabies
Risk • The probability of a disease-free individual developing a given disease over a specified period, conditional on that individual not dying from any other disease during the period • Risk is without units, ranges from 0 to 1 • Risk = Attack rate in outbreak settings # events of disease during time period Population at risk at start of period
Odds • The probability of an event occurring compared to the probability of that event not occurring Probability event occurs Probability event does NOT occur
What is the probability of rolling a two? 1 out of 6 = 1/6 What are the odds of rolling a two? Probability of rolling a two = 1/6 Probability of NOT rolling a two = 5/6 The odds of rolling two = 1/6 = 1 = 1 in 5 5/6 5
Note that the odds of rolling a two reduced to the number of ways to role a two (1) over the number of ways to not role a two (5) • Remember this when we talk about odds of exposure • The odds of exposure reduce to # exposed cases / # unexposed cases
2-by-2 tables Note that the disease status is across the top and the exposure status is on the left
2-by-2 tables Where a, b, c, d, are the number of individuals with those characteristics e.g., the number of individuals with disease and with exposure = a
2-by-2 tables Where v1, v2, h1, h2 are the column and row totals and T is the total number of individuals under study
Ratio Measures of Association • Assess the strength or magnitude of the statistical association between the exposure and disease of interest • In cohort studies, use relative risk • In case-control studies, use odds ratio
Relative Risk (RR) • The relative risk is the excess risk in the exposed group, compared to the unexposed (background, expected group) • Expressed as a ratio • RR = Riskexposed / Riskunexposed
Relative Risk (RR) • Riskexposed = # events of dz in exposed group pop’n at risk in exposed group = a / h1 • Riskunexposed = # events of dz in unexposed group pop’n at risk in unexposed group = c / h2 • RR = Riskexposed / Riskunexposed = a / h1 c / h2
Relative Risk (RR) • The RR will be > 1.0 when risk is greater in the exposed group than in the unexposed group • i.e., when exposure is risk factor for disease • The relative risk will be < 1.0 when risk in the exposed group is less than risk in the unexposed group • i.e., when exposure is protective • When no association between exposure and disease, RR = 1
Odds Ratio (OR) • In case-control studies, you cannot directly calculate the risk of disease because you do not have a denominator population • You can calculate the odds of exposure among cases and controls • The OR compares the odds of exposure in cases to the odds of exposure in controls
Odds Ratio (OR) Remember, exposure odds reduce to # exposed / # unexposed and can be calculated for both cases and controls • Exposure oddscases = # exposed in case group = a # unexposed in case group c • Exposure oddscontrols = # exposed in control group = b # unexposed in control group d • Exposure OR = a / c = a x d = ad b / d c b bc
Note that the OR reduces to ad bc the CROSS-PRODUCT ratio in a 2-by-2 table
Measures of Potential Impact • Reflect the apparent contribution of an exposure to the frequency of disease in a population • Important for policy makers and funding sources to understand impact a prevention program might have
Risk Difference • Also called excess risk, attributable risk Risk Difference = Riskexposed – Riskunexposed • Excess risk in those exposed
Attributable Risk Percent • Only appropriate if RR > 1 • Proportion of cases in the exposedgroup attributable to exposure • The most that we can hope to accomplish in reducing risk of disease if we completely eliminate the exposure (Riskexposed – Riskunexposed) / Riskexposed = (RR – 1) / RR
Population Attributable Risk Percent • Proportion of cases in the entire population (exposedand unexposed) attributable to exposure (Riskoverall – Riskunexposed) / Riskoverall
Prevented Fraction in the Exposed - Vaccine Efficacy • Comparable measure to attributable risk percent for a protective factor, such as vaccination • Only appropriate if the RR < 1.0 • Proportion of potential new cases which would have occurred had the exposure been absent (the proportion of potential cases prevented by the exposure) • Prevented fraction in the exposed = (Riskunexposed - Riskexposed) / Riskunexposed = 1 - RR