Download

1 / 21
270 likes | 422 Views
MAD Mean Absolute Deviation. Objective Find and interpret the mean absolute deviation for a set of data. Mean Absolute Deviation. The average distance between each data value and the mean. Measures of Center. Mean and Median. Measures of Variability. Range and MAD.

E N D
MAD Mean Absolute Deviation Objective Find and interpret the mean absolute deviation for a set of data.
Mean Absolute Deviation The average distancebetween each data value and the mean.
Measures of Center • Mean and Median Measures of Variability • Range and MAD
Mean Absolute Deviation The bigger (>) the MAD the more variation. The smaller (<) the MAD the less variation.
Steps 1. Find the mean. 2. Find the distance between data and the mean. 3. Find the average of the differences [Subtract the mean from each value - the result is called the deviation from the mean]
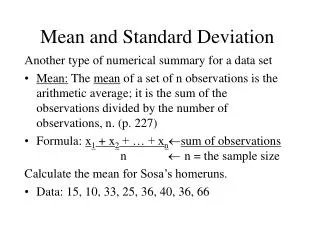
Find the Mean Number of cell phone contacts stored in 8 friends phones : 52, 48, 60, 55, 59, 54, 58, 62 Find the mean: 52+48+60+55+59+54+58+62=56 8
Find the Mean Absolute Deviation Find the deviation from the mean
Find the mean absolute deviation Number of cell phone contacts stored in 8 friends phones : 52, 48, 60, 55, 59, 54, 58, 62 Find the sum of the absolute values: 8 + 4 + 2 + 1 + 2 + 3 + 4 + 6 = 30 Divide the sum by the number of data items: 30 = 3.75 8
Find the mean absolute deviation Number of cell phone contacts stored in 8 friends phones : 52, 48, 60, 55, 59, 54, 58, 62 This means the average distance between each data value and the mean is 3.75 contacts.
Find the Mean Roller coaster speeds for 8 roller coasters were: 58, 88, 40, 60, 72, 66, 80 & 48 Find the mean: 58+88+40+60+72+66+80+48=64 8
Find the Mean Absolute Deviation Find the deviation from the mean
Find the mean absolute deviation Roller coaster speeds were: 58, 88, 40, 60, 72, 66, 80, 48 Find the sum of the absolute values: 6 + 24 + 24 + 4 + 8 + 2 + 16 + 16 = 100 Divide the sum by the number of data items: 100 = 12.5 8
Find the mean absolute deviation Roller coaster speeds were: 58, 88, 40, 60, 72, 66, 80, 48 This means the average distance each data value is from the mean is 12.5 miles per hour.
Find the mean absolute deviation Test scores for 6 students were : 85, 92, 88, 80, 91 and 74. • Find the mean: (85+92+88+80+91+74)/6=85 2. Find the deviation from the mean: 85-85=0 92-85=7 88-85=3 80-85=-5 91-85=6 74-85=-11
Find the mean absolute deviation Test scores for 6 students were : 85, 92, 88, 80, 91 and 74. 3. Find the absolute value of each deviation from the mean:
Find the mean absolute deviation Test scores for 6 students were : 85, 92, 88, 80, 91 and 74. 4. Find the sum of the absolute values: 0 + 7 + 3 + 5 + 6 + 11 = 32 5. Divide the sum by the number of data items: 32/6 = 5.3 The mean absolute deviation is 5.3.