Download
1 / 46
490 likes | 879 Views
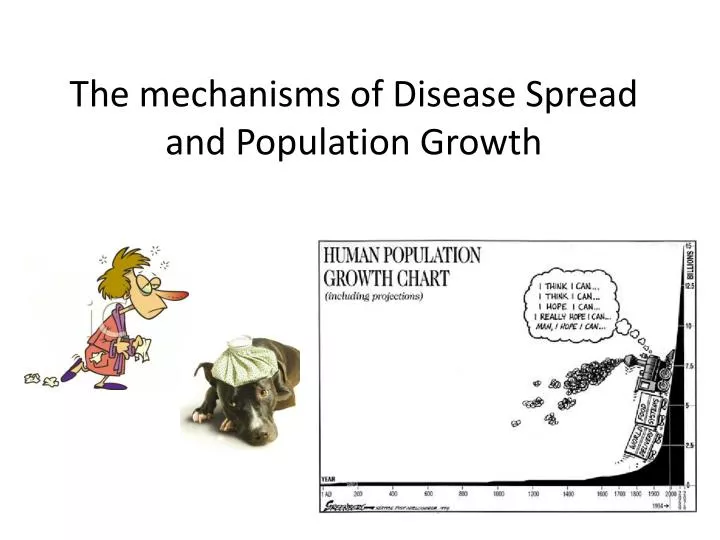
The mechanisms of Disease Spread and Population Growth. Causes of Infectious Disease. Caused by infective agents: Bacteria: These one-cell organisms are responsible for such illnesses as strep throat, urinary tract infections and tuberculosis

E N D
Causes of Infectious Disease • Caused by infective agents: • Bacteria: These one-cell organisms are responsible for such illnesses as strep throat, urinary tract infections and tuberculosis • Viruses: Even smaller than bacteria, viruses are the cause of a multitude of diseases — ranging from the common cold to AIDS • Fungi: Many skin diseases, such as ringworm or athlete's foot, are caused by fungi. Other types of fungi can infect your lungs or nervous system • Parasites.:Malaria is caused by a tiny parasite that is transmitted by a mosquito bite. Other parasites may be transmitted to humans from animal feces.
Disease Spread by Direct Contact • Coming in contact with someone who is ill or infected • Person to person: The most common way for infectious diseases to spread is through the direct transfer of bacteria, viruses or other germs from one person to another • Individual with the bacterium or virus touches, coughs on or kisses someone who isn't infected. • Exchange of body fluids from sexual contact or a blood transfusion
Disease Spread by Direct Contact • Animal to person: Pets can carry infectious agents • Being bitten or scratched by an infected animal • Handling animal waste -- toxoplasmosis infection by scooping your cat's litter box • Mother to unborn child: A pregnant woman may pass infectious diseases to her unborn baby • Some infectious agents can pass through the placenta • Agents in the vagina can be transmitted to the baby during the birthing process
Disease Spread by Indirect Contact • Many infectious agents can linger on an inanimate object, such as a tabletop, doorknob or faucet handle • Environmental transfer-- When you touch the same doorknob grasped by someone ill with the flu or a cold, for example, you can pick up the viruses he or she left behind. If you then touch your eyes, mouth or nose before washing your hands, you may become infected.
Disease Spread by Insect transfer (Insect bites) • Some infectious agents rely on insect carriers — such as mosquitoes, fleas, lice or ticks — to move from host to host • These carriers are known as vectors • Mosquitoes can be vectors for malaria parasite or West Nile virus, and deer ticks may be vectors for the bacterium that causes Lyme disease
Disease Spread by Food Contamination • Contaminated food and water • Infectious agents spread to many people through a single source • E. coli is a bacterium present in or on certain foods — such as undercooked hamburger or unwashed fruits or vegetables
Infection vs. Disease • Infection • Often the first step, occurs when bacteria, viruses or other microbes enter your body and begin to multiply • Disease • Disease occurs when the cells in your body are damaged — as a result of the infection — and signs and symptoms of an illness appear. In response to infection, your immune system springs into action: White blood cells, antibodies and other mechanisms goes to work to rid your body of whatever is causing the infection For instance, in fighting off the common cold, your body might react with fever, coughing and sneezing
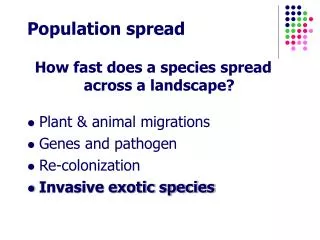
Spread of Disease in Ecological Systems • Splashing rain, water currents, air currents • Animal to animal transfer • Migration • Animal contamination (fecal deposition) • Environmental transfer • Plant to animal • Insect transfer
Spread of a disease • The rate of spread also has a lot to do with the nature of the disease • Length of being contagious • Transmission (air, water, food, diarrhea) • Transmission rate (i.e. the chance that any particular encounter will transmit the disease) • Death rate due to the disease • Epidemic occurs if contagion or transmission rate it exceeds the norm • Less lethal diseases will have higher contagion rates without a sense of emergency (such as the common cold or the common flu) • Small increases above the norm in diseases such as tuberculosis, HIV, Ebola, or other such highly lethal viruses, results in a state of emergency
Spread of a disease • Major differences between bacterial and viral illnesses. • Antibiotics work for bacterial disease, and sometimes vaccines can be developed for viral disease. • There isn't always a quick fix to an illness, however, since both bacteria and viruses mutate and alter their genetic makeup, making previous treatments non-effective.
Disease Simulation • Most diseases begin with what is called "the virgin field"—a scenario in which subjects (humans or other animals) have no natural or in case of humans, man-made immunity to the disease • http://www.learner.org/courses/envsci/interactives/disease/disease_help.php or http://goo.gl/VYj0y zero
Running a simulation http://goo.gl/VYj0y • In this first run-through: • population does not move around the field; they interact with their neighbors, but do not travel long distances. • run the simulator to 100 days (click on Run button) three times and answer the following: • Do you get the exact same results each time? How do the results compare to each other and to your prediction? What factors might contribute to susceptibility to the disease?
Running a simulation • Population density can impact the rate at which a disease moves through a population • Set parameters for low, medium, and high population density and run the simulation three times each • What could be done to prevent the spread of disease in a low population density? What kinds of challenges would high population density present to these precautions?
Running a simulation • Population mixing in a contagious area is analogous to increasing population density. Both increased density and increased movement of people bring more contagious people into contact with susceptible people, thus increasing the spread of disease • Set parameters to low, medium, and then high mixings and run simulation 3 times in each mode
Classroom simulation • Follow directions in handout
Births and immigration add individuals to a population. Births Immigration PopuIationsize Emigration Deaths Deaths and emigration remove individuals from a population. Population size = arrivals -departures “Arrivals” are referred to as NATALITY: Hatching, Born, Germinate “Departures” are measured as MORTALITY: can be measured as the number of deaths
Population Growth • In a population without immigration and emigration: Growth = births - deaths r = b - d This is referred to as biotic potential
Determination of biotic potential is tedious and time consuming
Exponential Growth • Growth without limits • Characteristic J-shaped curve • Growing at biotic potential [r]
Simulation of Exponential Growth • Website: http://goo.gl/ZheoL • Click “run applet” button • Follow directions on handout
Logistic Growth • Carrying capacity (K)- maximum population • Environmental resistance- slows growth • Characteristic S-shaped curve
How well does the logistic model fit the growth of real populations? • The growth of laboratory populations of some animals fits the S-shaped curves fairly well.
Some of the assumptions built into the logistic model do not apply to all populations. • It is a model which provides a basis from which we can compare real populations.
Simulation of Logistic Growth • Website: http://goo.gl/nedgA • Click “run applet” button • Follow directions on handout
Logistic: Oscillation Around K Birth rate = 3.0
Snowshoe hare 160 120 Lynx 9 Lynx population size (thousands) Hare population size (thousands) 80 6 40 3 0 0 1850 1875 1900 1925 Year Population Cycles • Some populations show regular boom and bust cycles
730,000 100,000 Commercial catch (kg) of male crabs (log scale) 10,000 1990 1950 1980 1960 1970 Year Extreme fluctuations in population size are often more common in invertebrate populations
FIELD STUDY Researchers regularly surveyed the population of moose on Isle Royale, Michigan, from 1960 to 2003. During that time, the lake never froze over, and so the moose population was isolated from the effects of immigration and emigration. RESULTS Over 43 years, this population experiencedtwo significant increases and collapses, as well as several less severe fluctuations in size. 2,500 Steady decline probably caused largely by wolf predation 2,000 1,500 Moose population size 1,000 Dramatic collapse caused by severe winter weather and food shortage, leading to starvation of more than 75% of the population 500 0 2000 1970 1980 1990 1960 Year CONCLUSION The pattern of population dynamics observedin this isolated population indicates that various biotic and abiotic factors can result in dramatic fluctuations over time in a moose population. Stability and Fluctuation • Long-term population studies have challenged the hypothesis that populations of large mammals are relatively stable over time
FIELD STUDY Researchers regularly surveyed the population of moose on Isle Royale, Michigan, from 1960 to 2003. During that time, the lake never froze over, and so the moose population was isolated from the effects of immigration and emigration. RESULTS Over 43 years, this population experiencedtwo significant increases and collapses, as well as several less severe fluctuations in size. 2,500 Steady decline probably caused largely by wolf predation 2,000 1,500 Moose population size 1,000 Dramatic collapse caused by severe winter weather and food shortage, leading to starvation of more than 75% of the population 500 0 2000 1970 1980 1990 1960 Year CONCLUSION The pattern of population dynamics observedin this isolated population indicates that various biotic and abiotic factors can result in dramatic fluctuations over time in a moose population. Stability and Fluctuation • Long-term population studies have challenged the hypothesis that populations of large mammals are relatively stable over time
FIELD STUDY Researchers regularly surveyed the population of moose on Isle Royale, Michigan, from 1960 to 2003. During that time, the lake never froze over, and so the moose population was isolated from the effects of immigration and emigration. RESULTS Over 43 years, this population experiencedtwo significant increases and collapses, as well as several less severe fluctuations in size. 2,500 Steady decline probably caused largely by wolf predation 2,000 1,500 Moose population size 1,000 Dramatic collapse caused by severe winter weather and food shortage, leading to starvation of more than 75% of the population 500 0 2000 1970 1980 1990 1960 Year CONCLUSION The pattern of population dynamics observedin this isolated population indicates that various biotic and abiotic factors can result in dramatic fluctuations over time in a moose population. Stability and Fluctuation • Long-term population studies have challenged the hypothesis that populations of large mammals are relatively stable over time
Age structure of populations • The ratio of the various age classes to each other in a population • Age pyramids portray the age-structure of a population • Ratio affects rates of population growth • Pre-reproductive (v. important) • Reproductive • Post-reproductive • Mortality and natality rates differ for different age groups
Population Growth Simulation • Start by running the simulator to 2050 for all seven countries (click on Run button). Record their population growth rates at the end of the simulated period • How do you suppose living conditions differ between the country furthest along in the demographic transition compared to the country earliest in the transition? How would living conditions in these two countries affect both birth and death rates? • Think of social factors that contribute to lower birth rates in the countries farther along. How might these social conditions be encouraged to emerge in less developed countries? • In general, how do the concepts of "early, middle, and late demographic transition" map to the concepts of "first, second, and third world countries"?
Demographic transition http://goo.gl/RvGWQ
Sources: • http://www.mayoclinic.com/health/infectious-diseases/DS01145/DSECTION=causes • http://www.learner.org/courses/envsci/interactives/disease/disease_help.php • http://www.learner.org/courses/envsci/interactives/demographics/demo_transition_1.php