Download
1 / 45
450 likes | 565 Views
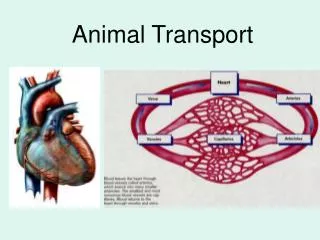
Animal transport: spread of disease and …. Uno Wennergren Tom Lindström Annie Jonsson Nina Håkansson Jenny Lennartsson Spatio-Temporal Biology Division of Theoretical Biology Linköping University Sweden. Animal transport 2006 - . Aims of different projects The context

E N D
Animal transport: spread of disease and …. Uno Wennergren Tom Lindström Annie Jonsson Nina Håkansson Jenny Lennartsson Spatio-Temporal BiologyDivision of Theoretical Biology Linköping University Sweden
Animal transport 2006 - • Aims of different projects • The context • Research groups, their expertise • Data base on animal movements • Specific research questions • Estimating probability of animal movements – Tom Lindström
Projects - aims - groups • Spread of disease: Foot and mouth disease. • Prepare to optimize intervention • Animal welfare • Reduce stress and distance transported
Spread of disease: Foot and mouth disease. Funded by Swedish Civil Contingencies Agency (Swedish DHS): 2 grants, PI’s: UW and SSL at SVA • Prepare to optimize intervention • Spatio-Temporal Biology (4 persons) • Biology/Ecology • Mathematics • Scientific Computing • National Veterinary Institute (SVA) (3 persons) • Disease control and epidemiology • Veterinary medicine
Animal welfare • Reduce stress and distance per animal • Funded by Swedish Board of Agriculture (Swedish USDA) PI: UW • Spatio-Temporal Biology (3 persons) • Biology/Ecology • Mathematics • Scientific Computing • Dept. of Animal Environment and Health, Swedish University of Agricultural Sciences (2 persons) • Animal welfare • Veterinary medicine • Skogforsk, LiU, NHH (3 persons) • Optimization –Logistics • route planning –
Database Sweden • All animal (cattle and pigs) movements between farms and farms to slaughterhouses. • Not per vehicle • Cattle on individual level: birth, sale purchase, export, import, temporarily away (pasture), return from pasture, slaughter/house, death • Pig, on group level: as above • Report within seven days Farms and slaughterhouses in Sweden. Dots: blue –farms, red – large slaughterhouses. Green - smaller slaughterhouses. From Håkansson et al 2007.
Database -specifics • 12 months - cattle approximately 1 000 000 reports of sales and purhase • Important: errors in reports 10% • Possible to edit the database and reduce to 1% error by logical corrections (database cleaning) Spatial and temporal investigation of reported movements, births and deaths of cattle and pigs in Sweden. Submitted. Nöremark , Håkansson, Lindström, Wennergren, and Sternberg Lewerin.
Specific research questions • Other contacts between farms - questionnaire to farmers (SVA) • From measured contacts to probability of contact • Spread: Modeling disease specifics • Route planning of animal transport – effect on contacts and movement distance. • Production units: composition and configuration • Networks • Analysing transport network • Testing efficiency of network measures as predictors • Generating netorks • Testing linkdensity on network formation • Testing measures as predictors
1 ? 2
Specific research questions From measured contacts to probability of contact Estimating probabilities Tom Lindström
Animal movements between holdings • Which farms are likely to have contacts through animal movements? • Mathematical description. • Estimation from data. • Distance • Contacts between nearby farms are more common • Several different processes • Preventive Veterinary Medicine (any day now…)
A word on the data • Should be good… • Pigs reported at transport level by the receiving farmer • Cattle reported at individual level by farmers at both origin and end. • Cattle moved on the same day between same farms constitute one transport • Mismatch • “Cleaning” using the identity of cattle • Locations of many cattle farms not in the database but areas of valid for subsidies • Inactive farms in the data base
Quantifying distance dependence • Distance dependence needs two measurements. Probability of contacts has • Scale • Measured as Variance (or Squared Displacement) • Shape • Measured as Kurtosis
Variance P Distance
Kurtosis P Distance
Why these measures? • Important to have quantities for comparison • Between epidemics • Between types of contacts • Between years • Theoretical connection to biological invasions • Squared displacement relates to diffusion constant. • Discrete representation of space (i.e. farms has X,Y coordinates) => Fat tails more important
Kernel function • A generalized normal distribution • Variance and Kurtosis given by a and b. • Extended to two dimensions (X,Y coordinates) • S normalizes the kernel, Volume=1.
Kernel function normalization • With discrete representation of farm distribution normalization over all possible destination farms d is distance, iis start farm, k is possible destination farms (k≠i) and N is number of farms.
Kernel function normalization • This separates spatial pattern of farms from distance dependence in contacts. • Important if farm distribution is non random. • Farm density in Sweden (farms/km2)
And USA From Shields and Mathews, 2003
Is the kernel function good enough? . • A single distribution may not be sufficient to fit data on multiple scales (both short and long distance contacts). • An alternative model • A mixture model • Part distance dependent and part uniform (Mass Action Mixing) • Models applied to pig and cattle transports (all transports during one year).
An alternative model . • f1is distance dependent part: • f2 is MAM part: • w is proportion of distance dependence
Fitting to data • Bayesian approach • Increasingly common at least in ecological literature. Ellison 2008
Markov Chain Monte Carlo • Parameters obtained through Markov Chain Monte Carlo (MCMC). • Well suitable for epidemiological problems. • A simple model can be expanded to include complexity. • Drawback is computation time, and effective parallelization is difficult.
Markov Chain Monte Carlo • Repeated (correlated) random draws from the posterior distribution of parameters. • Gibbs Sampling • Direct draws from known distributions conditional on other parameter values • Metropolis-Hastings • Values are proposed and subsequently accepted or rejected dependent on likelihood ratios
Markov Chain Monte Carlo • Also allows for model selection by comparing the full posterior distribution of model probabilities. • In our study, the mixture model was a much better model. Cattle Pigs
Comparing models and observed data Cattle Pigs Bars: observed transport distances. Dotted line: predictions by Model 1. Solid line: predictions by Model 2
Network measures • Will differences have consequences for estimation of disease spread dynamics? • Networks generated with the different models • Network measures • Nodes (farms) and links (transports) C D A B
Network measures • Density – proportion of farms connected Model 1 Model 2
Network measures • Clustering Coefficient – proportion of “triplets” • If A is connected to B and C, are B and C connected? C D A B Model 1 Model 2
Network measures • Fragmentation index – measures the amount of fragments not connected to the rest. E C D A D F B Model 1 Model 2
Network measures • Betweeness centralization index – Are some nodes more central than others? E C D E C D A A D F B D F B Model 1 Model 2
Animal transports • Higher Cluster Coefficient and lower Density for Model 2 • Depends on difference in short distance contacts • Depletion of susceptibles • Group Betweeness higher for Model 1 in Cattle. • Due to long distance transport being more rare • Conclusion: Model 2 is a better model (higher likelihood) and the difference may have impact on disease spread prediction.
More than distance? • Why not compare to observed networks? • Is there something but distance that matter? • Some work in progress…
More than distance? • Pig industry very structured, production types • Multiplying herd • Sow pool central unit • Sow pool satellite herd • Fattening herd • Farrow to finish herd • Piglet producing herd • Nucleus herd http://www.swedishmeats.com
From To
Production types in cattle? • Dairy and beef producers • Male calves on dairy farms are often sold to beef producers (at lest in Sweden) • Other differences in production types? • Roping? • Organic farming? • Climate/geografic factors
More than distance? • Reality is messy… • Data base not perfect • Missing production types • Several production types per farms • Weights in the model • A farm is a fraction of each possible type. • One parameter estimation per combination (sender/receiver) of production types.
More than distance? • Size dependence • Size (Capacity) • Two different sizes • Adult sows • Piglets • Different production types have different response • Different for sending or receiving • Total 64x4 parameters just for size… • Modeled as power function (Sizeθ)
More than distance? • Distance dependence • Different for different production types • Variance, Kurtosis and mixing parameter for each combination
More than distance? • Many parameters… 9*64=576 • Some combinations of production types have few transports => uncertain estimations. • Variance and kurtosis not clearly different from ∞. • Using a prior may help • But it’s nicer to be objective…
Hierarchical Bayesian • We can let the data decide the prior • Hyper parameters • Hierarchical Bayesian model • “Borrowing strength”
Animal transports – part 2 P(θ ) θ1 θ2 θ3 θn Data
Hierarchical Bayesian • When would this make sense? • If parameters values are expected to be different but not totally different • E.g. distance… • Parameter estimations based on much data… • Little influence of hierarchical prior • Parameter estimations with little data… • Highly influenced by the hierarchical prior. Increases the variance of the prior distribution.
Thank you • Questions?