Download

1 / 19
190 likes | 380 Views
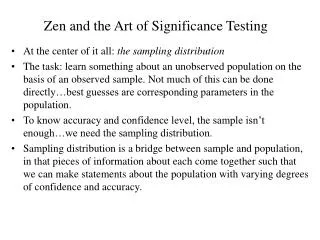
Testing the Significance of Attribute Interactions. Aleks Jakulin & Ivan Bratko Faculty of Computer and Information Science University of Ljubljana Slovenia. Overview. Interactions: The key to understanding many peculiarities in machine learning.

E N D
Testing the Significance of Attribute Interactions Aleks Jakulin & Ivan Bratko Faculty of Computer and Information Science University of Ljubljana Slovenia
Overview • Interactions: • The key to understanding many peculiarities in machine learning. • Feature importance measures the 2-way interaction between an attribute and the label, but there are interactions of higher orders. • An information-theoretic view of interactions: • Information theory provides a simple “algebra” of interactions, based on summing and subtracting entropy terms (e.g., mutual information). • Part-to-whole approximations: • An interaction is an irreducible dependence. Information-theoretic expressions are model comparisons! • Significance testing: • As with all model comparisons, we can investigate the significance of the model difference.
Example 1: Feature Subset Selection with NBC The calibration of the classifier (expected likelihood of an instance’s label) first improves then deteriorates as we add attributes. The optimal number is ~8 attributes. The first few attributes are important, the rest is noise?
Example 1: Feature Subset Selection with NBC NO! We sorted the attributes from the worst to the best. It is some of the best attributes that deteriorate the performance! Why?
Example 2: Spiral/XOR/Parity Problems Either attribute (x, y) is irrelevant when alone. Together, they make a perfect blue/red classifier.
label C importance of attribute A importance of attribute B attribute attribute A B attribute correlation 3-Way Interaction: What is common to A, B and C together; and cannot be inferred from any subset of attributes. 2-Way Interactions What is going on?Interactions
Entropy given C’s empirical probability distribution (p = [0.2, 0.8]). H(C|A) = H(C)-I(A;C) Conditional entropy - Remaining uncertainty in C after learning A. H(A) Information which came with the knowledge of A H(AB) Joint entropy I(A;C)=H(A)+H(C)-H(AC) Mutual information or information gain --- How much have A and C in common? Quantification: Shannon’s Entropy A C
Interaction Information How informative are A and B together? I(A;B;C) := I(AB;C) - I(A;C) - I(B;C) = I(B;C|A) - I(B;C) = I(A;C|B) - I(A;C) • (Partial) history of independent reinventions: • Quastler ‘53 (Info. Theory in Biology) - measure of specificity • McGill ‘54 (Psychometrika) - interaction information • Han ‘80 (Information & Control) - multiple mutual information • Yeung ‘91 (IEEE Trans. On Inf. Theory) - mutual information • Grabisch&Roubens ‘99 (I. J. of Game Theory) - Banzhaf interaction index • Matsuda ‘00 (Physical Review E) - higher-order mutual inf. • Brenner et al. ‘00 (Neural Computation) - average synergy • Demšar ’02 (A thesis in machine learning) - relative information gain • Bell ‘03 (NIPS02, ICA2003) - co-information • Jakulin ‘02 - interaction gain
Information gain: 100% I(A;C)/H(C) The attribute “explains” 1.98% of label entropy A positive interaction: 100% I(A;B;C)/H(C) The two attributes are in a synergy: treating them holistically may result in 1.85% extra uncertainty explained. A negative interaction: 100% I(A;B;C)/H(C) The two attributes are slightly redundant: 1.15% of label uncertainty is explained by each of the two attributes. Applications: Interaction Graphs CMC domain: the label is the ‘contraceptive method’ used by a couple.
uninformative attribute informative attribute information gain Interaction as Attribute Proximity weakly interacting strongly interacting cluster “tightness” loose tight
Part-to-Whole Approximation Mutual information: • Whole: P(A,B) Parts:{P(A), P(B)} • Approximation: • Kullback-Leibler divergence as the measure of difference: • Also applies for predictive accuracy:
Kirkwood Superposition Approximation It is a closed form part-to-whole approximation, a special case of Kikuchi and mean-field approximations. is not normalized, explaining the negative interaction information. It is not optimal (loglinear models beat it).
Significance Testing • Tries to answer the question: “When is P much better than P’?” • It is based on the realization that even the correct probabilistic model P can expect to make an error for a sample of finite size. • The notion of self-loss captures the distribution of loss of the complex model (“variance”). • The notion of approximation loss captures the loss caused by using a simpler model (“bias”). • P is significantly better than P’ when the error made by P’ is greater than the self-loss in 99.5% of cases. The P-value can be at most 0.05.
Test-Bootstrap Protocol To obtain the self-loss distribution, we perturb the test data, which is a bootstrap sample from the whole data set. As the loss function, we employ KL-divergence: VERY similar to assuming that D(P’||P) has a χ2 distribution.
Cross-Validation Protocol • P-values ignore the variation in approximation loss and the generalization power of a classifier. • CV-values are based on the following perturbation procedure:
The Myth of Average Performance The distribution of How much do the mode/median/mean of the above distribution tell you about which model to select? ← interaction (complex) winsapproximation(simple) wins →
Summary • The existence of an interaction implies the need for a more complex model that joins the attributes. • Feature relevance is an interaction of order 2. • If there is no interaction, a complex model is unnecessary. • Information theory provides an approximate “algebra” for investigating interactions. • The difference between two models is a distribution, not a scalar. • Occam’s P-Razor: Pick the simplest model among those that are not significantly worse than the best one.