Download
1 / 22
220 likes | 341 Views
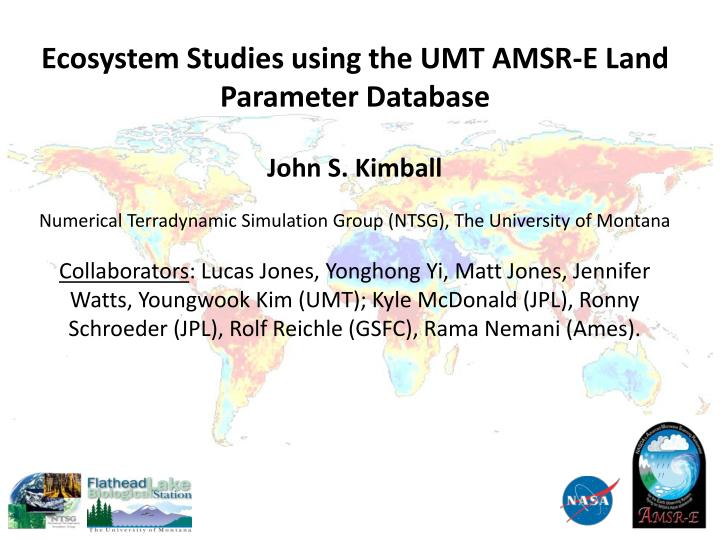
Ecosystem Studies using the UMT AMSR-E Land Parameter Database. John S. Kimball Numerical Terradynamic Simulation Group (NTSG), The University of Montana

E N D
Ecosystem Studies using the UMT AMSR-E Land Parameter Database John S. Kimball Numerical Terradynamic Simulation Group (NTSG), The University of Montana Collaborators: Lucas Jones, Yonghong Yi, Matt Jones, Jennifer Watts, Youngwook Kim (UMT); Kyle McDonald (JPL), Ronny Schroeder (JPL), Rolf Reichle (GSFC), Rama Nemani (Ames).
Recent Activities: • Continuing evaluation of the UMT AMSR-E global land parameter database; • Parameter Verification using global biophysical measurement networks, synergistic data from other satellite products & model reanalysis; • Global Implementation of a terrestrial carbon flux model (TCF) using AMSR-E & MODIS inputs; • Research highlights including vegetation phenology, ecosystem carbon source-sink activity, freeze/thaw & inundation dynamics; • Algorithm development & refinement for the NASA SMAP mission: L4 Carbon products.
Atm. Water Vapor [V, mm] Surface Air Temperature [Tmx,mn; °C] Open Water Fraction [Fw] Soil Moisture [mv, vol.] Vegetation Optical Depth (VOD) The UMT AMSR-E Global Land Parameter Database Data Characteristics: • Variables: Tmx,mn; mv (10.7, 6.9 GHz); Fw; VOD (10.7, 6.9, 18.7 GHz); V (total col.); • Global, daily coverage; • Period of Record: 2002 – 2008. • Product maturity: 3-7 (TRL) • Available online (NSIDC) • Reprocessing planned 1.5 1.0 0 0.5
Evaluating Daily T and SM Time Series from AMSR-E and MERRA WMO weather stations USA Biophysical stations (SCAN, Ameriflux, …) Source: Yi, Kimball, Jones, Reichle, McDonald, 2011. Journal of Climate
Combining AMSRE & MERRA Soil Moisture using Data Assimilation Lethbridge, Alberta (Grasslands) Weights [0,1] Anom MERRA (Re-analysis Soil Moisture) Seas Full AMSR-E (Satellite Soil Moisture) Less Skill; Less weight More Skill; More weight TRMM 3B42 (Satellite Precip.) Jones, L. A. et. al. J. Hydrometeorology (in prep.)
Level 4 Carbon Algorithm Development for SMAP Tundra (2Samoylov Island, Siberia) AMSR-E / MERRA MODIS Soil T Soil Moisture Scalar Multipliers [0,1] (1) • A level 4 carbon product (L4_C) is being developed as part of the Soil Moisture Active Passive Mission (SMAP); • Algorithm employs a 3-pool soil decomposition model (1TCF) with ancillary GPP, T & SM inputs; • Initial L4_C global runs are driven by MODIS, AMSR-E & reanalysis (MERRA) inputs; [g C m-2] (2) SMAP Mission: http://smap.jpl.nasa.gov 1Kimball, J.S., L.A. Jones, et al. 2009. IEEE TGARS, 47(2), 569-587; 2Tower eddy covariance data provided courtesy of Torsten Sachs (tower PI).
Woody Savannah (Tonzi Ranch, CA1) TT : Tower Met. + Tower GPP TT AT : AMSR-E Met. + Tower GPP TM: Tower Met. + MODIS GPP AM TT AT TM Flux tower obs. AM: AMSR-E Met. + MODIS GPP Prediction Median AT NEE [g C m-2 8d-1] AM NEE RMSE [g C m-2 d-1] L4_C/TCF Calibration & Validation using FLUXNET sites Original FLUXNET tower CO2 flux data is used for model calibration & validation (e.g. left). Baseline model performance is generally within expected accuracy (NEE RMSE<30 g C m-2 yr-1 or 1.6 g C m-2 d-1). A Markov Chain Monte Carlo (MCMC) optimization is applied to minimize an objective function by adjusting biome-specific model parameters to representative tower data, including calibrating soil moisture response curves (center) for better accuracy. Uncalibrated model runs (right) using alternative remote sensing & tower inputs are also used to clarify error propagation & uncertainty sources. Vaira Santa Rita2 Tonzi 1D. Baldocchi is PI of Tonzi and Vaira FLUXNET tower sites; 2R. Scott is PI of Santa Rita Site
Global L4_C/TCF Simulations using MODIS-MERRA Inputs Annual NEE was estimated at a 0.5 degree spatial resolution globally over a 7-year record using daily time series MERRA (SM, T) & MODIS (GPP) inputs. Estimated global carbon (NEE) source (+) & sink (-) variability is strongly affected by tropical (EBF) areas (above); large source activity in the tropics is driven by regional drought-induced GPP decline.
Initial conditions (1ESRL) Initial conditions (L4_C) July 2003 Final optimized C-flux (L4_C) Final optimized C-flux (1ESRL) 1http://www.esrl.noaa.gov/gmd/ccgg/carbontracker Quantifying Land Source-Sink activity for CO2 • The L4_C NEE (g C m-2 d-1) outputs provide initial conditions for 1CarbonTracker inversions of terrestrial CO2 source/sink activity; • Differences in final optimized monthly C-fluxes relative to 1ESRL baseline are strongly dependent on these initial “first guess” C-fluxes (right); • Atm. inversions provide additional verification of L4_C NEE against global flask network Obs. & other land models; • Results link C source-sink activity to underlying vegetation productivity & moisture/temperature controls.
Days Evaluating Landscape Freeze/Thaw Classifications from SSM/I and AMSR-E SSM/I (37V GHz) Mean Annual Non-Frozen Period (days, 2003-2010) Global Mean Annual Non-Frozen Period Trend AMSR-E (36V GHz) Mean Annual Non-Frozen Period (days, 2003-2010) We applied a temporal change 1classification of daily (AM, PM) Tb retrievals from SMMR, SSM/I & AMSR-E sensors for continuous global mapping of landscape freeze/thaw (FT) status over a 32-yr (1979-2010) record (above). AMSR-E & SSM/I produce similar FT results, but with some large differences for marginal FT & complex terrain areas (left). The AMSR-E results show generally longer mean non-frozen period, but with similar spatial & temporal variability relative to SSM/I. 1Kim et al. 2011. IEEE TGARS 43(3), 949-960.
FT values: 0=Frozen; 1=Thaw; 2= AM Frozen / PM Thaw Evaluating Landscape Freeze/Thaw (FT) Classifications from SSM/I and AMSR-E Mean Annual FT Spatial Classification Accuracy Relative to WMO T Sites FT Seasonal Dynamics Compared to Tower C-Flux and MODIS NDVI for selected FLUXNET sites Boreal ENLF Tower Site Mean annual FT spatial classification accuracy is similar between SSM/I & AMSR-E relative to the global WMO station network (left). The satellite FT signal bounds the vegetation growing season over northern (>45N) land areas, indicated from coincident satellite NDVI (MODIS) & tower CO2 fluxes over selected FLUXNET ecoregion types (right).
AMSR-E VOD A B C Global Phenology Monitoring using Vegetation Optical Depth (VOD) from AMSR-E • AMSR-E VOD (10.7GHz) is sensitive to canopy biomass & is well correlated with MODIS LAI, EVI & NDVI; • VOD is insensitive to clouds & illumination effects for improved global monitoring; • The AMSR-E VOD provides a unique & complimentary phenology signal. R-value MODIS LAI & AMSR-E VOD Correlation 8-Day Data 2003-2008 R-value M.O. Jones et al. 2010. Rem Sens. Environ. 115 Highest QC Data Availability MODIS EVI IGBP Barren Land Cover Class B A C -1.0 -.75 -.5 -.25 .25 .5 .75 1.0 Percent of Total (2003-2008) 0 – 20% 21-40% 41-60% 61-80% 81-100%
Linking AMSR-E VOD Seasonality to Ecosystem Dynamics Gassland, Oak Savanna Tower site AMSRE VOD MODIS 8 Day LAI Reco TIMESAT estimated 2005 Start of Season using AMSR-E VOD inputs (above). The VOD changes from AMSR-E are correlated (p<0.01) with coincident MODIS (8-day) LAI time series & ecosystem respiration (Reco) from tower eddy covariance CO2 measurements (left). The VOD signal provides a unique measure of vegetation biomass change that is less impacted by atmosphere effects than optical-IR remote sensing, enabling near daily global observations of vegetation conditions, but at relatively coarse spatial scales.
(AMSR-E only) Satellite Fw Analysis of Wetland Inundation Dynamics Schroeder et al. In prep.
Fw Fw Pan-Arctic Surface Inundation Trends from AMSR-E Fw AMSR-E based Fw inundation trends (2003-2010) overlain with a 1permafrost map for the pan-Arctic; significant (p≤0.10) Fw wetting (blue) &drying (red) areas are shown. The bar graph (left) shows the fraction (0-1) of cells with increasing or decreasing Fw trends for continuous, discontinuous & sporadic permafrost areas. These trends are in agreement with other studies indicating that inundation is increasing & decreasing over respective continuous & degrading permafrost areas. 1Source: International Permafrost Association (IPA) Watts et al. In prep.
Summary • Verification & analysis of the UMT AMSR-E land parameter database ongoing; data available online (NSIDC). Data reprocessing planned for updating (≥2010) & improving accuracy over the initial data record; • Maturity level of the UMT AMSR-E record varies by parameter; higher (1TRL~7) for T, VOD & Fw, lower (TRL~3) for mv & V; • Ecological investigations using these data are ongoing, including VOD phenology; terrestrial carbon (CO2) source/sink activity, freeze/thaw & Fw inundation dynamics; • TCF model calibration, testing & validation activities on-going in conjunction with L4 Carbon product development for SMAP. • Recent publications: • Yi, Y., J.S. Kimball, L.A. Jones, R.H. Reichle and K.C. McDonald, 2011. Evaluation of MERRA land surface estimates in preparation for the Soil Moisture Active Passive Mission. Journal of Climate (in press). • Jones, M.O., J.S. Kimball, K.C. McDonald, and L.A. Jones, 2011. Utilizing satellite passive microwave remote sensing for monitoring global land surface phenology. Remote Sensing of Environment 115, 1102-1114. • Kim, Y., J.S. Kimball, K.C. McDonald and J. Glassy, 2011. Developing a global data record of daily landscape freeze/thaw status using satellite passive microwave remote sensing. IEEE TGARS 49, 3, 949-960. 1Technology Readiness Level (TRL): http://esto.nasa.gov/files/TRL_definitions.pdf
Source: Yi, Kimball, Jones, Reichle, McDonald, 2011. J. Climate (in press)
Verification of AMSR-E VOD Phenology Metrics Estimated VOD Retrieval Uncertainty VOD Global Variability Relative to Land Cover Class Forward model estimates of AMSR-E (10.7 GHz) VOD retrieval error (above left) indicate increasing uncertainty at higher canopy biomass levels; however, the VOD results capture expected global biomass gradients and seasonal variability within and across the different land cover classes (above right). Source: M.O. Jones et al. 2011. Rem. Sens. Environ. 115, 1102-1114.
1AGB Tons/ha VOD Seasonality for Different Biomass Levels Comparison of AMSR-E (10.7 GHz) VOD seasonality for different vegetation 1biomass levels north and south of the equator in central Africa. Results show similar VOD seasonality up to relatively high biomass levels, with expected seasonal phase shift between northern and southern equatorial regions. 1Biomass map provided by Woods Hole Research Center (WHRC)
AMSR-E VOD vs MODIS LAI/NDVI Start of Season (2004 – 2007) Lag ~6-8 wks VOD 10 GHz Lag ~4-6 wks VOD earlier VOD later VOD ~equal NDVI LAI