Download
1 / 1
10 likes | 128 Views
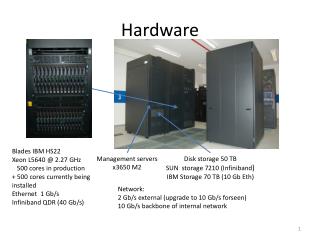
Design A Sensor Prototype for Blueberry Bruising Study During Mechanical Harvesting Pengcheng Yu, Changying Li, Glen Rains, Takoi Hamrita. SENSING SOFTWARE DEVELOPMENT. INTRODUCTION Blueberry industry enjoyed exponential growth in the past three decades

E N D
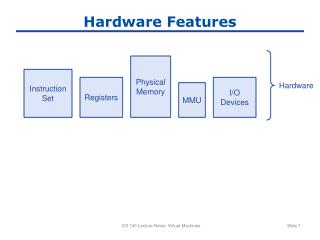
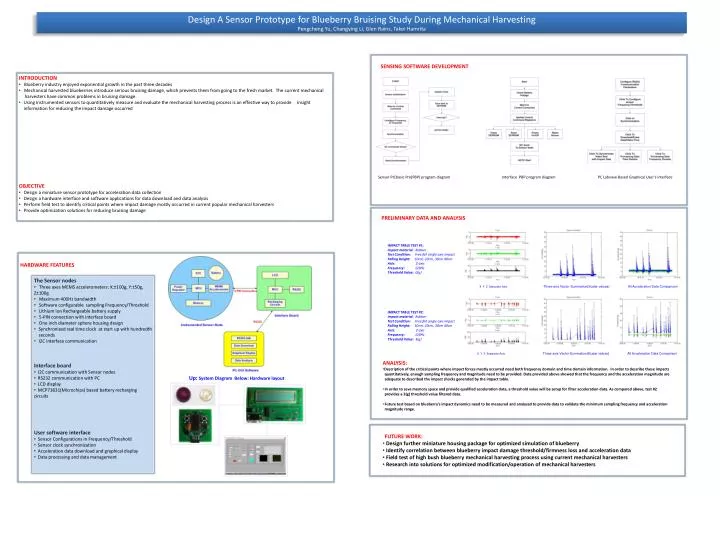
Design A Sensor Prototype for Blueberry Bruising Study During Mechanical Harvesting Pengcheng Yu, Changying Li, Glen Rains, TakoiHamrita SENSING SOFTWARE DEVELOPMENT • INTRODUCTION • Blueberry industry enjoyed exponential growth in the past three decades • Mechanical harvested blueberries introduce serious bruising damage, which prevents them from going to the fresh market. The current mechanical • harvesters have common problems in bruising damage. • Using Instrumented sensors to quantitatively measure and evaluate the mechanical harvesting process is an effective way to provide insight information for reducing the impact damage occurred • OBJECTIVE • Design a miniature sensor prototype for acceleration data collection • Design a hardware interface and software applications for data download and data analysis • Perform field test to identify critical points where impact damage mostly occurred in current popular mechanical harvesters • Provide optimization solutions for reducing bruising damage Sensor PICbasic Pro(PBP) program diagram Interface PBP program diagram PC Labview Based Graphical User’s interface PRELIMINARY DATA AND ANALYSIS IMPACT TABLE TEST #1: Impact material: Rubber Test Condition: Free fall single axis impact Falling Height: 10cm, 20cm, 30cm 40cm Axis: Z-axis Frequency: 120Hz Threshold Value: 0(g) HARDWARE FEATURES • The Sensor nodes • Three axes MEMS accelerometers: X:±100g, Y:±50g, Z±100g • Maximum 400Hz bandwidth • Software configurable sampling Frequency/Threshold • Lithium Ion Rechargeable battery supply • 5-PIN connection with interface board • One inch diameter sphere housing design • Synchronized real time clock at start up with hundredth seconds • I2C interface communication • Interface board • I2C communication with Sensor nodes • RS232 communication with PC • LCD display • MCP73831(Microchips) based battery recharging circuits • User software interface • Sensor Configurations in Frequency/Threshold • Sensor clock synchronization • Acceleration data download and graphical display • Data processing and data management X Y Z Separate Axis Three-axis Vector Summation(Scalar values) All Acceleration Data Comparison IMPACT TABLE TEST #2: Impact material: Rubber Test Condition: Free fall single axis impact Falling Height: 10cm, 20cm, 30cm 40cm Axis: Z-axis Frequency: 120Hz Threshold Value: 3(g) X Y Z Separate Axis Three-axis Vector Summation(Scalar values) All Acceleration Data Comparison • ANALYSIS: • Description of the critical points where impact forces mostly occurred need both frequency domain and time domain information. In order to describe these impacts • quantitatively, enough sampling frequency and magnitude need to be provided. Data provided above showed that the frequency and the acceleration magnitude are adequate to described the impact shocks generated by the impact table. • In order to save memory space and provide qualified acceleration data, a threshold value will be setup for filter acceleration data. As compared above, test #2 provides a 3(g) threshold value filtered data. • Future test based on blueberry’s impact dynamics need to be measured and analyzed to provide data to validate the minimum sampling frequency and acceleration magnitude range. Up: System Diagram Below: Hardware layout • FUTURE WORK: • Design further miniature housing package for optimized simulation of blueberry • Identify correlation between blueberry impact damage threshold/firmness loss and acceleration data • Field test of high bush blueberry mechanical harvesting process using current mechanical harvesters • Research into solutions for optimized modification/operation of mechanical harvesters