Download
1 / 35
350 likes | 497 Views
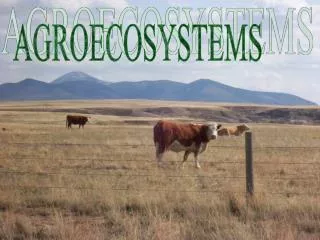
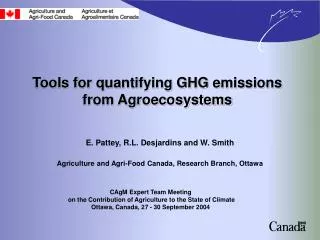
Tools for quantifying GHG emissions from Agroecosystems. E. Pattey, R.L. Desjardins and W. Smith. Agriculture and Agri-Food Canada, Research Branch, Ottawa. CAgM Expert Team Meeting on the Contribution of Agriculture to the State of Climate Ottawa, Canada, 27 - 30 September 2004.

E N D
Tools for quantifying GHG emissions from Agroecosystems E. Pattey, R.L. Desjardins and W. Smith Agriculture and Agri-Food Canada, Research Branch, Ottawa CAgM Expert Team Meeting on the Contribution of Agriculture to the State of Climate Ottawa, Canada, 27 - 30 September 2004
INTRODUCTION • Goals: • Develop a set of reliable Models for estimating net GHG emissions from agricultural sources/sinks and for deriving emissions factors relevant of a given country situation. • Establish a series of databases of the various agricultural activities for integrating the GHG emissions over space and time domains (land use, mgt practices, animal production, climate…) .
INTRODUCTION (Cont’d) • A “reliable” Model is: • sensitive to input conditions such as management practices; • adapted to the geographical and climatic conditions under which it will be used; • based on sound scientific knowledge. • …Ideally it requires a set of input descriptors easily available. • Framework: • Any national GHG emission accounting system needs to be transparent (well-documented), verifiable (pilot test sites, scaling-up experiments etc.) and consistent with the Kyoto Protocol.
OUTLINE • Speaker more familiar with Canadian situation Example of Canada… • GHG emission estimates from agricultural sources in Canada, CO2, CH4, N2O • Tools for developing models (chamber, tower) • Tools for verifying temporal dynamic and top-down constraints (tower, aircraft) • Results from tower- aircraft-based measuring systems • Modeling results from Ecosys, DNDC and Daycent • Summary
2001 1981 1986 1991 1996 64 63 Total 57 56 53 Greenhouse Gas Emissions from Canada’s Agroecosystems (100 Year Time Horizon - Tg of CO2 equivalents) 0 CO2 8 7 5 2 24 CH4 22 19 20 23 40 N2O 27 30 28 38
GHG flux measuring techniques only cover a limited portion of the space and time domains Area m2 1 10 102 103 104 105 106 107 108 109 Chamber Aircraft BLS & Tracer 1 Mass Balance Atmospheric Inversion 10 Time h Tower 102 Soil Cores Satellite 103 Regional and sub-continental estimates using tall towers and CBL budgets 104
Proposed Framework for a Accounting/Verification System Regional Flux and Surface Feature Measurements Regional/ National Estimates Verification Scaling Up • climate • soils • topography • land use • land • management Model Refinement Data collection Regional (Spatial) databases Auditing/Monitoring “Ecosystem Models” Process Studies Research Needs Driving variables Model Refinement Verification Verification Long Term Experimental Sites: Flux, Meteorological and Ancillary Measurements FGHG Benchmark Sites Inventory/ Monitoring Sites DCs
How do we improve and verify models? Regional & Nat’l GHG budget (with uncertainty estimates) Verifying temporal dynamic Top-Down constraint Measuring towers, blimps aircraft Modeling Virtual Farm (with uncertainty estimates) Measuring chambers, towers Developing new knowledge on mgt practices time
Non-Flow Through, Non-Steady State Chamber Measurements Fg = dC V Mw dt A Mv Experimental design for comparing management practices and environmental conditions
Tower-based Measurements Sonic anemometer Air Intakes Closed-path Tunable Diode Laser
Setup for quantifying N2O fluxes for two management practices 1 TDL connected to 2 micromet. towers
Meas. model Urea applied at the following rates: Non-linear increase of N2O emissions with fertilizer application rate 0.218 0.254 0.120 0.120 ECOSYS Grant, R. and Pattey, E., 2003. Modelling variability in N2O emissions from fertilized agricultural fields. Soil Biology and Biochemistry:35(2): 225-243.
Flux Towers are the only suitable measuring approach … during Snow melt (Permanent Site, Ottawa)
The global Fluxnet project features towers tracking the movement of carbon dioxide between various ecosystems and the air with emphasis on forest Establish a network of towers for measuring N2O fluxes to verify temporal dynamics of models and assist in scaling up from individual agricultural fields to region Biocap Euroflux Ameriflux Japanflux
The REA sampling system and TDL Laser Aircraft REA system Laboratory TDL Laser
AC/Tower Study Sites, Spring 2001, 2003 and 2004 Canada 0 5 10 15 km Casselman Flight Track Tower Site Morewood Flight Track
cereals pasture/grass alfalfa forest soy corn town Casselman Flight Track LEGEND N Highway417 Casselman 13km 12 km
30 Casselman 25 Morewood 20 15 Percentage (%) 10 5 0 Hay Alfalfa Corn Soybean Forest Pasture Cereals Mean Crop Cover in 2000 within Footprint of Aircraft Transects
ng N2O-N m2 s kg N2O-N ha day FN2O by AC (1130 to 1430) FN2O by AC kg N2O-N ha day ng N2O-N m2 s FN2O by Tower (1130 to 1430) FN2O by Tower Combining Tower and Aircraft N2O Fluxes Unknown =
Schematic of the major components of the DNDC model Ecological drivers Climate Soil Vegetation Anthropogenic activity Crop Growth Decomposition Soil Climate Effect of temperature and moisture on decomposition Soil environmental factors Temperature Moisture pH Anaerobic balloon Substrates (NH4+, NO3- and DOC) Denitrification Nitrification Exchange of NO and N2O N Gas Emissions Fluxes of NO, N2O, N2 and NH3
Using models for obtaining regional and national estimates Regional & Nat’l GHG budget (with uncertainty estimates) Measuring Modeling time
Challenge: The net impact of management practices changes with time 5 Soil C gain 4 Option A Cumulative C (T ha-1) 3 Cumulative net GHG emissions Net gain 2 Cumulative CO2-C from N fertilizer (50 kg N ha-1) Option B 0 1 Option C 0 0 20 40 60 80 100 time Time (years) Option A
Estimated Direct N2O-N Emissions from Agriculture Soils in Canada Using DNDC (1970-1999) 90 Estimated direct annual N2O-N emissions 80 Estimated direct spring N2O-N emissions 70 60 50 Gg N2O-N 40 30 20 10 0 1970 1972 1974 1976 1978 1980 1982 1984 1986 1988 1990 1992 1994 1996 1998 Year
“Model” province region SLC polygon National C and GHG Accounting and Verification System • “Situations” defined by: • Soil • Climate • Land use • Management country SOC & GHG Emissions for each “situation”
Verification by direct measurement of national GHG estimates best done through holistic top-down national, continental, or global scale GHG budgets N2O emissions?
Scientific uncertainty 80 Relative uncertainty (estimated) 60 40 GHG emission (Mt CO2 equiv. per year) 20 0 -20 -40 CO2 CH4 N2O
Uncertainty 0 Understanding Scientific uncertainty
Tools to quantify uncertainties • Sensitivity tests of models • Monte-Carlo approach for evaluating uncertainty
Summary • Tools for measuring GHG fluxes only cover a limited portion of the space and time domains • The combination of tower and aircraft-based GHG flux measurements provide valuable information to estimate regional fluxes on a daily basis • Models are essential for deriving national estimates of GHG emissions • Models still require lots of verification and improvement to provide more accurate estimates