Download
1 / 22
220 likes | 351 Views
The Future of Artic Sea Ice. By: W. Maslowski , Jaclyn Clement Kinney, Matthew Higgins, and Andrew Roberts. Thomas West; Senior in Atmospheric Sciences. A Video on Arctic Sea Ice. https://www.youtube.com/ watch?v =UVzCOoQY28Y. The Seven Parts of the Paper . 1) Introduction

E N D
The Future of Artic Sea Ice By: W. Maslowski, Jaclyn Clement Kinney, Matthew Higgins, and Andrew Roberts Thomas West; Senior in Atmospheric Sciences
A Video on Arctic Sea Ice • https://www.youtube.com/watch?v=UVzCOoQY28Y
The Seven Parts of the Paper • 1) Introduction • 2) State and Projections of Arctic Sea Ice • 3) Atmospheric Forcing of Sea Ice • 4) Modeling of Future Arctic Sea Ice Change • 5) Model Limitations and Biases • 6) Transition from Global Climate to Hierarchical System Modeling • 7) Future Advancements for Improved Arctic Sea Ice Prediction
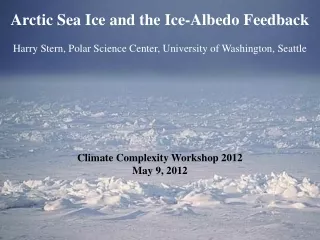
Introduction • The arctic is important for global climate evolution • The sea ice cover is most important because it buffers air-sea heat fluxes. • It also influences the absorption of solar radiation through the albedo of ice. • Global warming has been most active in the declining perennial ice sheet in the 1990’s and the 2000’s. • In the past, accelerated warming has not been associated with a positive AO (Atlantic Oscillation). • This shows that the importance of oceanic forcing over longer timescales relative to atmospheric forcing acting alone. • A warmer Arctic climate appears to affect the rate of melt of the Greenland ice sheet, Northern Hemisphere permafrost, sea-level rise, and global climate change.
Average Minimum Ice Extent The graph above shows the mean sea ice extent for the months of March and September along with September 2007 minimum ice extent in red and the minimum September 2011 ice extent in the light green.
State and Projections of Arctic Sea Ice State Projections The figure on the next slide shows estimates obtained using the NAME (Naval Postgraduate School Arctic Modeling Effort) regional ice-ocean model This is a hindcast model driven by daily reanalyzed and operational surface atmospheric data from the European Center for Medium-Range Weather Forecasts (ECMWF) • Warming in the Arctic Ocean has increased in the past several years. • Summer ice pack has the biggest decrease has a result. • Summer ice has decreased 6.5% a decade from 1979-2001 and accelerates to 8.6% through 2005, to 10.2% through 2007, to 12% per decade through 2011.
Age of Decline • This graph shows the yearly ice extent on top from 1980-2010 and below the ice thickness from 1980 to 2005 • This shows that the extent has remained fairly consistent but the thickness of the ice has rapidly decreased in the past years.
Figure A) October-December1988 sea ice thickness by submarine. Figure B) October-November 2003-2008 sea ice thickness by submarine.Figure C) October-November 1988 by NAMEFigure D) October-November 2004 by NAME
Atmospheric Forcing of Sea Ice • Recent studies show that the winds in the lower atmosphere are responsible for half the variance in sea ice extent and one-third of the downward trend in sea ice over the past several decades • You can use the summer of 2007 as a prime example. • In 2007, ice cover was its lowest on record in large because of atmospheric forcing.
Atmospheric forcing continued • A strong and persistent AD pattern advected the sea ice away from the western Arctic and towards the center. • This coupled with the specific strength and SLP pattern favoring ice retreat. • Also the strong anti-cyclonic pattern centered over the Beaufort Sea and North American Arctic Basin reducing cloud cover enhancing downwelling shortwave radiation. • This added up to an increase of 500% of shortwave radiation into the ocean with an accelerated ice-albedo feedback.
What about the winter of 2009-10 • The AO was strongly negative, thus this means it leads to a build up of multiyear ice. • But this didn’t happen, in fact it should of led to minimal sea ice loss in the summer of 2010 but that summer ended with the third lowest sea ice extent on record… why? • This was because of the continual decrease in multiyear sea ice combined with a shifts of the atmospheric forcing of sea ice during the AO pattern of that summer.
Importance of Modeling Atmospheric Interaction with Sea Ice • Its important to try to model this interaction as close to possible without many assumptions. • Some improvements can be made in order to have a better picture on ice movement. • The GCM’s (Global Climate Models) used today are good at predicting the large scale movements but not on the smaller regional movements.
Modeling of Future Arctic Sea Ice Change • There has been many studies that have tried to predict what the future of the ice has in store, leading to wide ranging results. • The GCM’s used in The Arctic Climate Impact Assessment shows by the end of this century a 50% reduction in summer sea ice. • The World Climate Research Program shows just a little more than a 10% decrease in spite of doubling of CO2. • The Intergovernmentle Panel for Climate Change Fourth Assessment suggests an almost ice free Arctic in summer at the end of this century and by 2040 in the most extreme circumstances.
This figure shows the average sea ice thickness from the month of September from the years 2000-2004. As you can see in the figure below, the deepest average ice in September from 2000-2004 is only 3.5m.This shows a concern of diminishing sea ice in the summer months.
Attempt at Detailed Sea Ice Volumes • On the following slide is a chart that was an attempt to determine the ice volume in the future • The solid blue line shows the observed ice volumes. • The green dashed line shows the NAME trend from 1979-2004, the pink dashed shows the name trend from 1979-1996, purple dashed line shows from 1996-2004, red dashed line is combined NAME 1996-2004 and Kwok and Cunningham work in 2008 from, the black dash is NAME from 1996-2004 and Cunningham work in 2009
Model Limitations and Biases • There are several processes that are omitted or poorly represented in the models. • These processes include the following: oceanic eddies, tides, fronts, buoyancy-driven coastal and boundary currents, cold halocline, dense water plumes and convection, double diffusion, surface/bottom mixed layer, sea ice–thickness distribution, concentration, deformation, drift and export, fast ice, snow cover, melt ponds and surface albedo, atmospheric loading, clouds and fronts, ice sheets/caps and mountain glaciers, permafrost, river runoff, and air–sea ice–land interactions and coupling.
Tale of the Straits • The Fram Strait—this is one of the main straits that directly affects the Arctic Sea Ice. • Barents Sea Opening—this is a large area that has a heat flow into the Arctic from water waters which also directly impacts the formation and melt of Arctic Sea Ice annually.
This chart below shows the in, out, and net flows of volume and heat from the CCSM and the NAME models through the Fram Strait, Barents Sea Opening and the area between Franz Josef Land and Novaya Zemly to capture the outflow of Atlantic Water into the Arctic Ocean
Transition from Global Climate to Hierarchical System Modeling • Currently the use of GCM’s involves limited skill in the modeling of the far northern parts of the Earth. • The targets of newer models is centered on the biogeochemical and physical processes that are expected to have a major influence with the surface of Arctic Ocean energy and mass budgets. • These newer models will take the output of those major influences and use that to try to paint a better picture of what might happen in the future of the Arctic Sea Ice.
Future Advancements for Improved Arctic Sea Ice Prediction • There has been more fine-resolution global climate configurations that have been developed and tested. • These models through the testing have proven the higher resolution enhances the outlook better than before • Downside—the cost to use these models will highly restrict there use • The other solution is under way with the development of a variable resolution or a unrestricted grid approach.