Download
1 / 29
290 likes | 419 Views
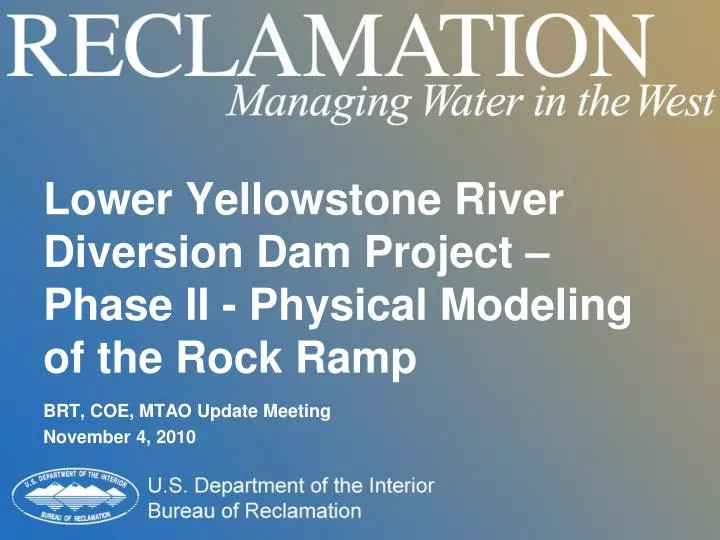
Lower Yellowstone River Diversion Dam Project – Phase II - Physical Modeling of the Rock Ramp. BRT, COE, MTAO Update Meeting November 4, 2010. Introduction. Headworks is being constructed. The model has been reconstructed at a 1:25 scale for investigating the rock ramp flow conditions.

E N D
Lower Yellowstone River Diversion Dam Project – Phase II - Physical Modeling of the Rock Ramp BRT, COE, MTAO Update Meeting November 4, 2010
Introduction • Headworks is being constructed. • The model has been reconstructed at a 1:25 scale for investigating the rock ramp flow conditions. • Crest design is the same as phase I • 70-ft-wide thalweg with gently sloping sides till meeting banks • Ramp has 3 400 - 500-ft-long mildly sloping sections dropping to the river channel. • A short section of the upstream and downstream river channel are included.
Model Objectives The major objectives of the rock ramp model study are: • Provide hydraulic data to support design of the facility with respect to rock ramp roughness, stability, and scour issues. • Evaluate dam crest upstream rating and revise geometry to meet minimum objectives for the diversion weir. • Evaluate dam crest flow conditions (average velocity and depth) and revise for sturgeon passage. • Evaluate ramp flow conditions and revise design geometry to enhance fish passage. This would include the potential addition of fish passage opportunities in the form of boulder fields, depressions, thalweg improvements, etc. • Evaluate flow patterns and velocity downstream of the ramp toe to evaluate the need for scour protection at the toe or assist with design of toe or bank protection.
1:25 scale Physical Model Layout of Entire Ramp S=0.006 S=0.004 S=0.002
Walkway over model Downstream end of model Ramp thalweg New & old headworks Crest River channel approach 1:25 Scale Model of the Full Rock Ramp FLOW
1:25 Scale Model of the Full Rock Ramp Comparison of as-built to drawing for fully choked condition - good agreement ± 1’ prototype (1/2” model)
1:25 Scale Model of the Full Rock Ramp Contours of model ramp fully choked condition
Ramp Investigations – Approach and Tailwater • Matched approach flow velocities and tailwater elevations at the model boundaries to those from the COE HEC-RAS models. • Velocities taken 100 ft upstream from the weir crest and tailwater elevations at the end of the ramp. • 3 pipes put flow in thalweg first then added to the right as the flow increased. Framed screens attached to the upstream topography template to reduce overbank velocities until close to the target values. Screen inserts
Three pipes providing flow to the model Measurement channels across ramp, first one over the crest 1:25 Scale Model of the Full Rock Ramp Ramp template
Initial Ramp Investigations • Upstream depths measured to assure adequate water surface elevations for diversion with the ramp crest geometry and roughness. • Velocities and depths measured in the thalweg for determination of fish passage and computation of ramp roughness and comparison to numerical model. • Data gathered with riprap alone (no choke material) then ½ choked, then fully choked • Testing conducted for 7, 15, 30, 40, and 70 kcfs.
Measurements • Velocities - Nixon propeller meter mounted on channels or localized with handheld 2D Flow Tracker • Depths - Massa ultrasonic sensors on channels & in stilling wells • Channel mounted measurements all automated.
Initial Ramp Investigations • Focusing today on 30,000 cfs flow • Initial model
Initial Ramp Investigations- Initial rock ramp with large riprap and no choke material
Initial Ramp Investigations • Upstream head for the initial rock ramp with large riprap and no choke material.
Initial Ramp Investigations • ½ choke condition
Initial Ramp Investigations • Full choke
Fish Passage Improvements • Crest and upper slope critical area for passage • Concentrate initial effort to the right of the thalweg near the crest, Q=30,000 cfs. • Plan – increase roughness reducing flow and velocity in fringe and increasing flow in main channel (ice, debris) (Elwha report) • Place widely spaced boulders, evaluate visually with dye and confetti, photogrammetry, measure velocity and depth, increase density till desired results obtained. • Change proximity to crest, repeat • Change overall width of section, repeat • Extend down ramp as necessary.
Fish Passage Improvements • Baseline – no boulders with more intensive data collected • Boulder size is a 6’ boulder buried by ½ • 1.5” in the model • Grid 1 - 36 boulders spaced on 120 by 50 ft grid all the way to thalweg • Grid 2 – 72 boulders spaced on 60 by 50 ft grid • Not much improvement! • Concentrated more to the right and decreased the boulder spacing. • Narrowed width of boulder field in 1/3 increments
Fish Passage Improvements • Grid 4 • Covers about 300 feet at crest with first row about 50 ft d/s • All boulders spaced at 5 boulder diameters or about 30 ft
Fish Passage Improvements • Width extent at crest tests- VELOCITY @ 30 kcfs
Fish Passage Improvements • Width extent at crest tests - DEPTH @ 30 kcfs
Fish Passage Improvements • Grid 6 • 200’ of crest width used • Left 100’ at 5 boulder diameters • Right 100’ at 3 boulder diameters • D/s 250’ follows contours
Fish Passage Improvements • Grid 7 • Same as grid 6 • Additional row added 25’ d/s • Bottom 250’ all boulders at 3 boulder diameters
Fish Passage Improvements • Crest velocities – measured data @ 30 kcfs • Grid 6 - D/s 250 ft is shifted left with same boulder spacing as grid 5 (5 boulder diameters). • Right 100 ft affected by approach velocities.
Fish Passage Improvements • Crest depths @ 30 kcfs – measured data • Grid 6 seems acceptable
Fish Passage Improvements Grid 6 - From dye and confetti traces
Summary of Fish Passage Improvements • To Date: • Upstream head raised about 0.05 to 0.1 ft. • Thalweg crest velocities about 8.5 ft/s • about ½ to 1 ft/s greater than the baseline • Depths in fish passage corridor vary from about 4.5 ft to 3.5 ft. • Velocities in fish passage corridor vary from < 4 ft/s to about 7 ft/s. Decreased in boulder field by 1-2 ft/s. • Diversity added to ramp in boulder field • Variable due to boulder spacing and locations, and crest, sloping ramp and topography influence on flow conditions • Thinking that passage treatment is not necessary downstream from the first ramp slope.
Remaining Modeling Tasks • Address upstream approach velocity needs (locally roughen the topography). • Continue refining fish passage corridor as necessary. • Evaluate fish passage and scour potential at the ramp toe. • Provide final report.