Download
1 / 9
90 likes | 192 Views
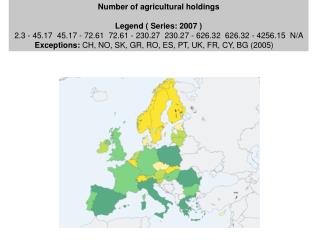
Number of agricultural holdings Legend ( Series: 2007 ) 2.3 - 45.17 45.17 - 72.61 72.61 - 230.27 230.27 - 626.32 626.32 - 4256.15 N/A Exceptions: CH, NO, SK, GR, RO, ES, PT, UK, FR, CY, BG (2005) . Total farm labour force (1000 AWU) Legend ( Series: 2007 )

E N D
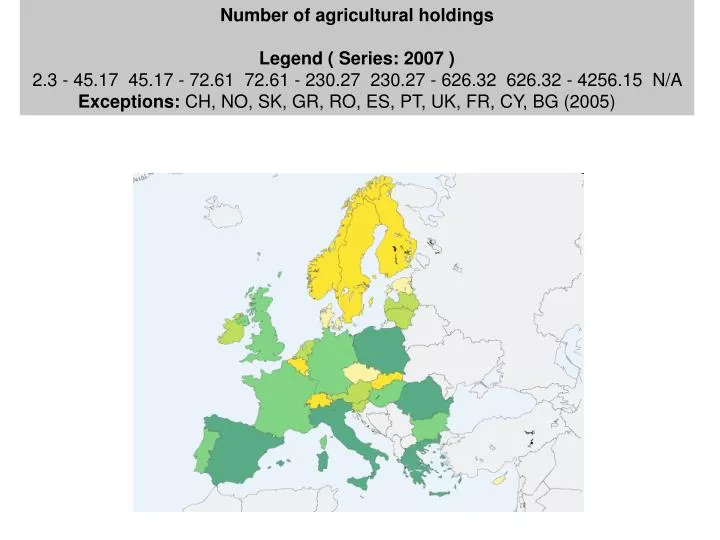
Number of agricultural holdings Legend ( Series: 2007 ) 2.3 - 45.17 45.17 - 72.61 72.61 - 230.27 230.27 - 626.32 626.32 - 4256.15 N/A Exceptions: CH, NO, SK, GR, RO, ES, PT, UK, FR, CY, BG (2005)
Total farm labour force (1000 AWU) Legend ( Series: 2007 ) 3.75 - 58.83 58.83 - 104.79 104.79 - 339.08 339.08 - 855.49 855.49 - 2595.59 N/A Exceptions: NO, SK, GR, RO, ES, PT, UK, FR, CY, BG (2005) Labour force includes everyone (over the legal age limit) having provided an agricultural work on and for the holding during the last 12 months. The work time of each person is recorded as percentage of a full-time. One AWU equals the work of a full-time employee.
Agricultural holders < 35 years old (1000 persons) Legend ( Series: 2007 ) 0.12 - 2.6 2.6 - 4.59 4.59 - 9.74 9.74 - 49.07 49.07 - 293.75 N/A Exceptions: NO, SK, GR, RO, ES, PT, UK, FR, CY, BG (2005)
Agricultural holders > = 65 years old (1000 persons) Legend ( Series: 2007 ) 0.36 - 7.28 7.28 - 17.8 17.8 - 75.11 75.11 - 306.73 306.73 - 1848.97 N/A Exceptions: NO, SK, GR, RO, ES, PT, UK, FR, CY, BG (2005)
Production of cereals 1 000 t Legend ( Series: 2008 ) 2.9 - 785.7 785.7 - 1622.6 1622.6 - 3622.3 3622.3 - 9300.0 9300.0 - 69291.1 N/A Exceptions: MK, SK, NL, GR, IT, SI, RO, UK, AT, BG (2007) NO (2006) IS (1997)
Collection of cows' milk (1 000 t) Legend ( Series: 2007 ) 40.59 - 530.37 530.37 - 964.22 964.22 - 2293.02 2293.02 - 5241.1 5241.1 - 27320.73 N/A Exceptions: IS (2005) NO, MK (1996) Data covers cows' milk collected in farms by approved dairies. A distinction should be made between "milk collected by dairies" and "milk production on the farm". Milk collection is only a part of the total use of milk production on the farm. The other part of the use of milk produced on the farm generally includes domestic consumption, direct sale and cattle feed.
Total roundwood production (1 000 m³) Legend ( Series: 2007 ) 0.0 - 1523.0 1523.0 - 5702.0 5702.0 - 10514.0 10514.0 - 21317.0 21317.0 - 77200.0 N/A Exceptions: CH, DK, GR, LU, PT, HR, TR (2006) LI (1998) Roundwood production (the term is used as a synonymous term for "removals") comprise all quantities of wood removed from the forest and other wooded land or other felling site during a certain period of time. It is reported in cubic metres underbark (i.e excluding bark).
Fishing fleet. Total power (kW) Legend ( Series: 2007 ) 8700.0 - 57131.0 57131.0 - 97438.0 97438.0 - 277679.0 277679.0 - 862764.0 862764.0 - 1248882.0 N/A
Annual catches in all regions (1 000 t live weight) The total annual catch of fishery products Legend ( Series: 2006 ) 0.0 - 1.0 1.0 - 23.0 23.0 - 153.0 153.0 - 433.0 433.0 - 2245.0 N/A Exceptions: CH, MK, LU, LI, HR, TR (2005)