Download
1 / 17
170 likes | 285 Views
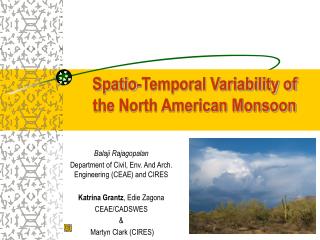
Spatio-temporal Distribution of Latent Heating in the Southeast Asian Monsoon Region. Manuel Zuluaga, Carlos Hoyos and Peter Webster. School of Earth and Atmospheric Sciences Georgia Institute of Technology Graduate Student Symposium November 2, 2007. Why study Latent Heating?.

E N D
Spatio-temporal Distribution of Latent Heating in the Southeast Asian Monsoon Region Manuel Zuluaga, Carlos Hoyos and Peter Webster School of Earth and Atmospheric Sciences Georgia Institute of Technology Graduate Student Symposium November 2, 2007
Why study Latent Heating? • The total diabatic heat absorbed and released is the primary agent of the vertical energy transport… fuel of tropical motions. • Response of a tropical atmosphere to a heating as forcing After Gill, 1982
Examine and produce 3D LH structures. • Explore differences with Inter-annual and Intraseasonal variability. • Produce a diagnostic dataset to parameterize an atmospheric circulation model Objectives Latent heating in model parameterizations • Vertical heating variations have been received few attention in the physical and model parameterizations. • Model assumptions: geographically uniform vertical LH and no large-scale variability • Difficulties in estimation due to the lack of high-resolution data over extended spatio-temporal scales. • Data from satellite derived information is trying to help to fulfill this deficiency. After Schumacher et al, 2004
Data • Convective and Stratiform Heating (CSH) algorithm. (TRMM mission). • Monthly mean values for a tropical band (37°N - 37°S) and 2.5x2.5 pixel size were used. • The algorithm compute LH using several runs of a Cloud Resolving Model and then normalizing by precipitation. • Information of surface precipitation rates, percentage of its stratiform rain component and the type and location of the observed cloud system is used to compute LH values.
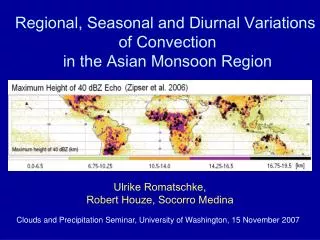
Latent Heating average for 1998-2006 • Higher values of heating related with cloudiness and precipitation regions (Monsoon regions, warm pool, ITCZ, SPCZ). • Lower values over winter hemisphere and desertic regions
Vertical profiles of LH • In general heating distribution is related with cloud characteristics. • Different inter-annual variability for different regions.
After Hoyos and Webster, 2007 South Asian Monsoon region • Special region with a conjunction of warm SST and high and spatially complex distribution of mean precipitation. • Propagation characteristics of intra-seasonal oscillations. • A well representation of the circulation and its associated precipitation has been elusive in model results.
Inter-annual LH variability • High amount of heating in some special regions (Bay of Bengal, BoB and Equatorial Indian Ocean, EIO) in special over ocean • Lower values over land regions.
Vertical LH profiles • Profile shapes related with type of cloudiness • Interannual variability showing years with less and higher release of LH
Vertical LH profiles • Profiles showing relation with orographic precipitation • Different inter-annual variability also through the vertical profile
Intra-seasonal relationships • The monsoon ISO is the dominant large-scale feature of the monsoon region. • Highest pattern of ISO is shown over the EIO and BoB regions within period of 25-80 days. • Monsoon ISO considerably alters the entire monsoon circulation • Active phase is defined as time intervals where rainfall anomalies in the 25-80 day band are positive. Summer averaged wavelet spectra for GPCP rainfall. After Hoyos and Webster, 2007
Dipole-like structure due to the northward wave propagation in the summer period. Intra-seasonal LH variations • ISO signal over EIO through the entire year. • Positive LH anomalies for EIO and Bangladesh region on active phase and for BoB on break phase.
Break phase Active phase Intra-seasonal variations N • Northward propagation of the ISO wave • Amplitude of variability within ISO activity appears stronger as in the inter-annual variability
Conclusions and Future work • Satellite LH retrievals used as model parameterization can improve physical response of GCM. • LH retrievals in agreement with precipitative cloud system. • This CSH data diagnostic shows good representation of intrinsic temporal LH variability (inter-annual and intra-seasonal). • Next step: this datasets will be used as input parameter to force a GCM.
Intra-seasonal LH variations • ISO signal over EIO through the entire year. • Positive LH anomalies for EIO and Bangladesh region on active phase and for BoB on break phase. • Dipole “like” structure due to the northward wave propagation in the summer period.
Intra-seasonal variations • Northward dipole structure • Amplitude of variability within ISO activity appears stronger than the inter-annual variability