Download
1 / 11
110 likes | 196 Views
Millions of Pounds. Year of Recorded Catch. Figure 1. Annual pink shrimp catch for the West coast of Florida (1960-2006). 9. Millions of Pounds. Year of Recorded Landing. Figure 2. Annual pink shrimp catch (1960-2006) for the West Coast of Florida illustrating all of the sub-areas. 10.

E N D
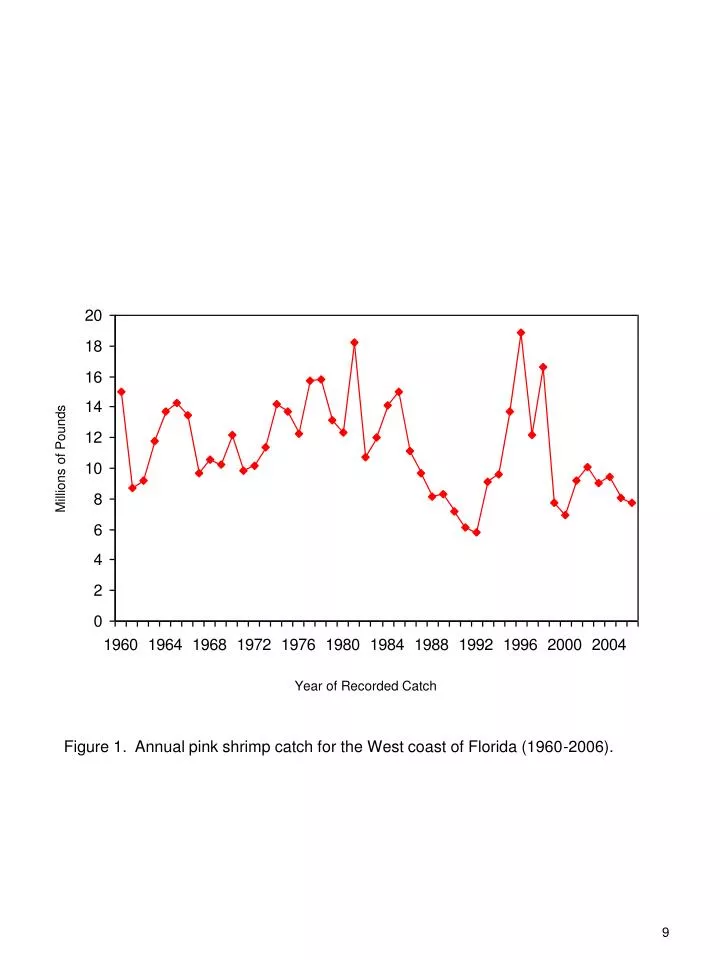
Millions of Pounds Year of Recorded Catch Figure 1. Annual pink shrimp catch for the West coast of Florida (1960-2006). 9
Millions of Pounds Year of Recorded Landing Figure 2. Annual pink shrimp catch (1960-2006) for the West Coast of Florida illustrating all of the sub-areas. 10
Millions of Pounds Figure 3. Pink shrimp catch for the Tortugas grounds (sub-areas 1-3) and the West coast of Florida (sub-areas 1-9) for biological years 1960-2005. 11
Proportion of Total Catch Year of Recorded Landing Figure 4. Size distribution of shrimp landed from the Tortugas grounds 1980 – 2006, expressed as a percentage of the total catch. 12
Millions of Pounds Year of Recorded Landing Figure 5. Size distribution of shrimp landed from the Tortugas grounds 1980-2006. 13
Catch in Lbs. (x100,000) Figure 6. Average monthly historical catch (1960-1985) compared to recent catch (January 1988-December 2006) landed from the Tortugas grounds. 14
Thousand of Days Fished Figure 7. Pink shrimp fishing effort on the Tortugas grounds (subareas 1-3) and the west coast of Florida (subareas 1-9) for biological years 1960-2005. 15
Pounds per Day Fished Figure 8. Pink shrimp catch per unit effort (CPUE) for the Tortugas grounds subareas 1-3) and the west coast of Florida (subareas 1-9) for biological years 1960-2005. 16
Billions of Shrimp Figure 9. Estimates of pink shrimp recruitment on the Tortugas grounds for biological years 1960-2005. Horizontal line illustrates long term mean recruitment. 17
Billions of Recruited Shrimp Figure 10. Estimate of seasonal pink shrimp recruitment on the Tortugas grounds for calendar year 1960-2005. 18
1995 1997 1996 1960 1985 2001 1994 Billions of Recruited Shrimp 1998 2000 2002 1999 1992 2003 1991 2005 1990 Figure 11. Relationship of pink shrimp parent stocks (age 5+month shrimp) and recruitment, 1960-2005. 19