Download
1 / 18
180 likes | 281 Views
Discover how MOLA topography revealed a 1-2 km vertical error in Viking lander trajectories, impacting density and pressure readings. Explore topographic profiles and implications for Mars research.

E N D
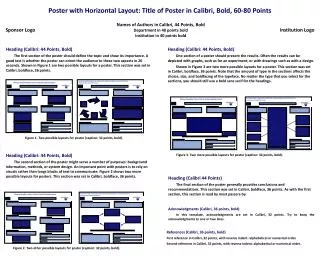
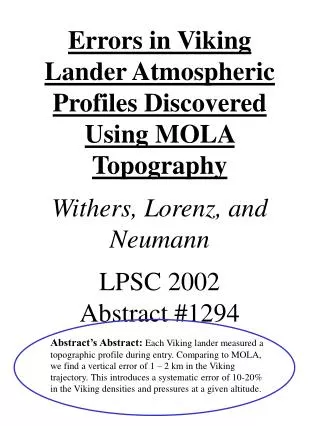
Errors in Viking Lander Atmospheric Profiles Discovered Using MOLA TopographyWithers, Lorenz, and NeumannLPSC 2002Abstract #1294 Abstract’s Abstract:Each Viking lander measured a topographic profile during entry. Comparing to MOLA, we find a vertical error of 1 – 2 km in the Viking trajectory. This introduces a systematic error of 10-20% in the Viking densities and pressures at a given altitude.
Poster Layout • 1st column • Viking’s Radar Altimeter • 2nd column • Topographic Profile from Viking Entry • 3rd column • Comparison of Viking Profile to MOLA Data • 4th column • Implications for Viking Atmospheric Profiles • 5th column • Closing Remarks
Viking Lander Schematic • Radar Altimeter located on base of lander From Soffen (1977)
Viking Lander Topographic Profiles • During descent, a radar altimeter ranged from the lander to the surface below. • The lander’s trajectory is known from the integration of acceleration data. • Combine trajectory and surface ranging to obtain a topographic profile along the ground track of the lander. • Altitude resolution for ranging ~ 100 m • Sample interval ~ 0.2 s • Maximum range ~ 130 km
VL1 Topographic Profile • Actually a profile of radial distance above landing site, not topographic height above an equipotential surface. • 5 km change in altitude over 500 km long portion of ground track • 640 km distance, 16o N, -57oE • 140 km distance, 21oN, -50oE • Sloping down from Tharsis into Chryse Planitia From Seiff (1993)
Hunting for the data • We have only this figure for VL1 – where are the tabulated results for VL1 and anything for VL2? • Seiff (1993) references Seiff and Kirk, Viking Lander Altimeter Update, in Minutes of the second meeting of the Viking Mars Physical Properties Working Group, assembled by JW Meredith, pp26-30, JPL, 1977. • We cannot locate this reference, nor have we found any other mention of this dataset in the literature. • Where can we find out more about the Viking Lander topographic profiles?
Quick Test on VL1 Profile • VL1 profile has topography 6 km above landing site 600 km away, but MOLA 1 degree planetary radius dataset shows that there is no topography 6km above landing site closer than 1000 km away. • Error in VL1 profile apparent in coarsest MOLA data. • MOLA 1 degree planetary radius contour map, referenced to VL1 landing site, with landing site and ground track for VL1 profile shown.
Deriving Corresponding MOLA Profile • Viking 1 landing site is 22.272 +/- 0.002 oN, 47.94 +/- 0.2 oW in Viking-era areocentric coordinates (Mayo et al, 1977). • Spacecraft trajectory (altitude, latitude and west longitude pairs as a function of time) is archived with the PDS as dataset PSPA-00269 in same coordinate system. • Subtract the west longitudes from east longitudes to convert them to east longitudes, then subtract an additional 0.2 degrees to convert into MGS-era east longitudes (Smith et al, 1998). • Use MOLA 1/16 degree planetary radius dataset to obtain MOLA values for planetary radius relative to landing site as a function of latitude and longitude. • Convert latitude/longitude pairs into distance from the VL1 landing site for comparison with the profile in Seiff’s figure.
Context Image • MOLA topography with landing site and ground track for VL1 profile shown.
Offset between Topographic Profiles • No offset has been applied to the comparison figure; the offset is present in the data. • Similar features can be seen in both profiles, so the VL1 radar altimeter was working well. • VL1 profile is 2.3 km too high at 640 km distance – VL1 altitude is 130 km. • VL1 profile is 0.8 km too high at 140 km distance – VL1 altitude is 30 km. • The offset decreases, in an approximately linear fashion, as you approach the landing site. • Based on the similarity of the profiles, errors in latitude and longitude are tenths of a degree at most.
Global Context and Location In Chryse Planitia, amongst outflow channels and near the hemispheric dichotomy VL1 Landing Site
VL1 Atmospheric Profiles • Measurements of accelerations during descent, together with an initial spacecraft position and velocity, are integrated to give the spacecraft’s trajectory down to the surface. • Accumulation of errors is controlled by using radar ranging data as additional constraints. • Acceleration data also yield profiles of atmospheric density, r, pressure, p, and temperature, T, along spacecraft’s trajectory. • These profiles are used to plan future atmospheric entries and are an important component of the Mars Reference Atmosphere.
Errors in VL1 Atmospheric Profiles • The radar altimeter data used to generate the VL1 topographic profile is referenced to the spacecraft’s trajectory. • The offset between MOLA and VL1 topography shows that the altitude of the spacecraft trajectory is systematically in error by 1 –2 km. • A published r, p, or T measurement at a given altitude is actually relevant at an altitude 1 – 2 km away. Hence the accepted profiles of r, p, and T as a function of altitude are incorrect. • Using a scale height of 10 km, published densities and pressures at a given altitude are systematically in error by 10 – 20%, but published temperatures are not significantly affected.
How to Correct the Atmospheric Profiles • Simple approach – Calculate error in VL1 altitude scale as a function of altitude by matching up VL1 and MOLA topographic profiles, then shift r, p, and T measurements from the incorrect altitude scale to the correct altitude scale. • Better approach – Rederive VL1 entry trajectory using additional constraint of MOLA topography together with radar altimeter data, then rederive atmospheric profiles using new trajectory.
Viking Density and Pressure Profiles • From Seiff and Kirk (1977a)
References • Mayo et al, 1977, JGR, v82, pp4297-4303 • Seiff and Kirk, 1977a, JGR, v82, pp4364-4378 • Seiff and Kirk, 1977b, Viking Lander Altimeter Update, in Minutes of the second meeting of the Viking Mars Physical Properties Working Group, assembled by JW Meredith, pp26-30, JPL – Have you seen this? • Seiff, 1993, JGR, v98, pp7461-7474 • Smith et al, 1998, Science, v279, pp1686-1692 • Soffen, 1977, JGR, v82, pp3959-3970 • Acknowledgements – Dave Smith, Maria Zuber, and the MOLA Science Team
Viking LanderEntry Sequence From Soffen (1977)