Download
1 / 15
150 likes | 260 Views
Chesapeake Bay Program Incorporation of Lag Times into the Decision Process. Gary Shenk 10/16/12. Chesapeake Bay Program Does Not Incorporate Lag Times into the Decision Process. No Lag in M odel or TMDL.

E N D
Chesapeake Bay ProgramIncorporation of Lag Timesinto the Decision Process Gary Shenk 10/16/12
Chesapeake Bay ProgramDoes Not Incorporate Lag Timesinto the Decision Process
No Lag in Model or TMDL • The goal of the TMDL and the Watershed Implementation Plans is to have practices in place by 2025 that will eventually lead to meeting the water quality standards • Watershed model scenario mode: • The long-term annual average loads given land use, land management, BMPs, point sources, atmospheric deposition, etc at steady state.
How the Watershed Model Works Hourly or daily values of Meteorological factors: Precipitation Temperature Evapotranspiration Wind Solar Radiation Dew point Cloud Cover Calibration Mode Annual, monthly, or daily values of anthropogenic factors: Land Use Acreage BMPs Fertilizer Manure Tillage Crop types Atmospheric deposition Waste water treatment Septic loads Daily flow, nitrogen, phosphorus, and sediment compared to observations over 21 years HSPF
Each segment consists of 30 separately-modeled land uses: Regulated Pervious Urban Regulated Impervious Urban Unregulated Pervious Urban Unregulated Impervious Urban Construction Extractive Combined Sewer System Wooded / Open Disturbed Forest Corn/Soy/Wheat rotation (high till) Corn/Soy/Wheat rotation (low till) Other Row Crops Alfalfa Nursery Pasture Degraded Riparian Pasture Afo / Cafo Fertilized Hay Unfertilized Hay Nutrient management versions of the above How the Watershed Model Works Plus: Point Source and Septic Loads, and Atmospheric Deposition Loads Each calibrated to nutrient and Sediment targets 6
Two Separate Segmentation Schemes • A land use within a land segment has the same inputs • atmospheric deposition • fertilizer • manure • precipitation • Land segmentation driven by availability of land use data • Land segments determined by • County lines • Rainfall Variances • Federal / Non-Federal
Land Simulation – 1 Acre 4 completely mixed soil layers Surface Interflow Lower Zone Ground Water Chesapeake Bay Program Modeling
Export Export Export Export Export Export Export Storages can Build up in the landscape Trees Denitrification Roots Leaves Nitrate Atmospheric Deposition Particulate Particulate Solution Labile Refractory Ammonia Organic N Organic N Solution Solution Adsorbed Labile Refractory Ammonia Organic N Organic N
How the Watershed Model Works Fertilizer Manure Atmospheric deposition Precipitation } Management filter Runoff Hydrology submodel Sediment submodel River Phosphorus submodel hourly Nitrogen submodel
Scale in Phase 5 - Sediment Edge of Field Expected loads from one acre BMP Factor Edge of Stream 60-100 sq miles Land Acre Factor Delivery Factor Scour/ Deposition In Stream Concentrations
Phase 5 river segmentation • A river segment gathers inputs from the watershed and has one simulated river • Consistent criteria over entire model domain • Greater than 100 cfs • or • Has a flow gage
How the Watershed Model Works Hourly or daily values of Meteorological factors: Precipitation Temperature Evapotranspiration Wind Solar Radiation Dew point Cloud Cover Scenario Mode Constant values of anthropogenic factors: Land Use Acreage BMPs Fertilizer Manure Tillage Crop types Atmospheric deposition Waste water treatment Septic loads Run for 1984-2000 Average 1991-2000 For ‘flow-normalized average annual loads’ HSPF
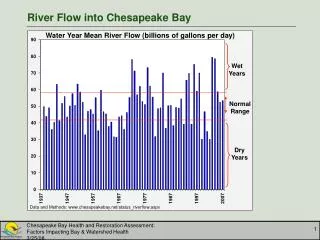
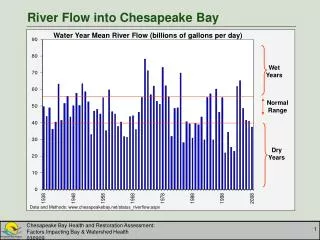
Nitrogen Loads Delivered to the Chesapeake Bay By Jurisdiction Point source loads reflect measured discharges while nonpoint source loads are based on an average-hydrology year Phase 4.3 Data 333.9 289.9 281.1 277.7 275.1 270.2 266.3 262.9 261.9 260.7 184.4 183.1 175 14
Lag Time • Calibration – the WSM is calibrated to observed data, so including important lagged processes would improve calibration • Validation of predictions – if the WSM is predicting changes in nutrient loads that are not seen in the monitoring data, would lags help to explain the difference. • Communication – When will the Chesapeake Bay respond to management actions