Download
1 / 17
170 likes | 277 Views
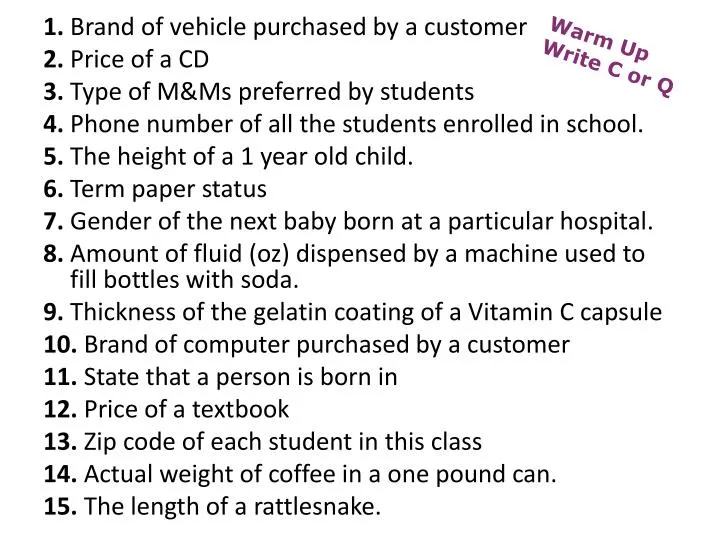
Warm Up Write C or Q . 1. Brand of vehicle purchased by a customer 2. Price of a CD 3. Type of M&Ms preferred by students 4. Phone number of all the students enrolled in school. 5. The height of a 1 year old child. 6. Term paper status

E N D
Warm Up Write C or Q 1. Brand of vehicle purchased by a customer 2. Price of a CD 3. Type of M&Ms preferred by students 4. Phone number of all the students enrolled in school. 5. The height of a 1 year old child. 6. Term paper status 7. Gender of the next baby born at a particular hospital. 8. Amount of fluid (oz) dispensed by a machine used to fill bottles with soda. 9. Thickness of the gelatin coating of a Vitamin C capsule 10. Brand of computer purchased by a customer 11. State that a person is born in 12. Price of a textbook 13. Zip code of each student in this class 14. Actual weight of coffee in a one pound can. 15. The length of a rattlesnake.
Describing Distributions SOCS • Shape • Outliers • Center • Spread
Shape • Mound shaped & symmetrical • Skewed left (extreme low values) • Skewed right (extreme high values) • Uniform
Outliers What do you think an outlier is?
Center When describing a distribution at first, the center can be “eyeballed.” Remember, you are trying to answer the question: “What is the most typical value?” Center is the median or mean.
Spread Range Remember, you are trying to answer the question: “How much do values typically vary from the center?” BE SURE TO STATE EVERYTHING IN CONTEXT!!
The test scores for Mrs. Nerd’s Algebra Class are listed below 50, 71, 71, 73, 77, 80, 80, 81, 85, 86, 87, 89, 94 • Create a frequency table b) Create a histogram
Describing Data (in context) SHAPE: Our data of ___________________ is shaped like ______________. OUTLIERS: CENTER: Students typically scored ______ on the test. SPREAD: Students scores ranged from ____ to _____ giving a spread of __________.
Students in a class stacked pennies in a 1 minute time limit.The results are shown to the right. 1.How many students were in the first period class? 2. How many and What percentage of students stacked more than 40 pennies using their dominant hand? 3. Are there any outliers?