Download
1 / 1
10 likes | 148 Views
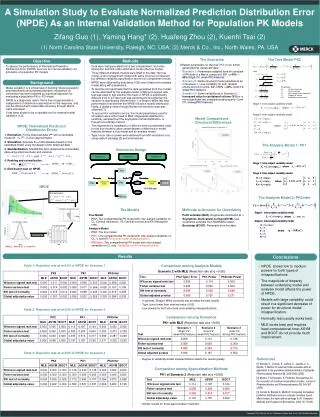
0.09. 0.08. 0.07. 0.06. 0.05. 0.04. 0.03. 0.02. 0.01. 0. Clinical concentration field of L-dopa. Computational grid. Optimal result,. Transport & Kinetic Inversion. Motivation. Novel Imaging Techniques. Methodology.

E N D
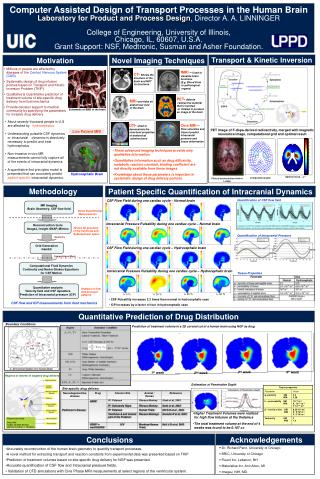
0.09 0.08 0.07 0.06 0.05 0.04 0.03 0.02 0.01 0 Clinical concentration field of L-dopa Computational grid Optimal result, Transport & Kinetic Inversion Motivation Novel Imaging Techniques Methodology • Millions of people are affected by diseases of the Central Nervous System (CNS) • Systematic design of drug infusion policies based on Transport and Kinetic Inversion Problem (TKIP) • Qualitative & Quantitative prediction of treatment volume of site-specific drug delivery from fluid mechanics • Provide decision support to medical community by specifying the parameters for invasive drug delivery fMRI –Used to visualize brain functions (E.g. Blood Flow to pathological organs) CT- Shows the structure of the brain and NOT its functions MR Imaging Brain Geometry, CSF flow field Direct Experimental Measurements Reconstruction tools ImageJ, Insight SNAP, Mimics PET- detects radioactive material that is injected or inhaled to produce an image of the brain 2D and 3D geometry of the Ventricles and Subarachnoid space MRI-provides an anatomical view of the brain Geometry Grid Generation Gambit Live Patient MRI Cine MRI – Flow velocities and Cannot predict intracranial pressure and tissue deformation • About seventy thousand people in U.S are affected by hydrocephalus. • Understanding pulsatile CSF dynamics or intracranial dynamics is absolutely necessary to predict and treat hydrocephalus • Non-invasive in-vivo MR measurements cannot fully capture all of the events of intracranial dynamics • A quantitative first principles model is presented that can accurately predict patient-specific intracranial dynamics. DTI-Used to demonstrate the structural properties of anatomical substructures Computational Mesh PET image of F-dopa-derived radioactivity, merged with magnetic resonance image, computational grid and optimal result Computational Fluid Dynamics Continuity and Navier-Stokes Equations for CSF Motion • These advanced imaging techniques provide only qualitative information. • Quantitative information such as drug diffusivity, metabolic reaction constant, binding coefficient are not directly available from these images. • Knowledge about these parameters is important in systematic design of drug delivery policies. Hydrocephalic Brain Quantitative analysis Velocity field and CSF dynamics Prediction of Intracranial pressure (ICP) Analysis of flow And pressure patterns CSF flow and ICP measurements from fluid mechanics Schematic of BBB in the brain 4th week 3rd week 1st week 2nd week Regions of interest in targeted drug delivery Present Case Study Drug: NGF Target: Caudate Nucleus Injection Location: 1. Thalamus Computer Assisted Design of Transport Processes in the Human BrainLaboratory for Product and Process Design, Director A. A. LINNINGERCollege of Engineering, University of Illinois,Chicago, IL, 60607, U.S.A. Grant Support: NSF, Medtronic, Susman and Asher Foundation. Patient Specific Quantification of Intracranial Dynamics Quantification of CSF flow field CSF Flow Field during one cardiac cycle – Normal brain Intracranial Pressure Pulsatility during one cardiac cycle – Normal brain Quantification of Intracranial Pressure CSF Flow Field during one cardiac cycle – Hydrocephalic brain Intracranial Pressure Pulsatility during one cardiac cycle – Hydrocephalic brain Tissue Properties t= 60 % t= 90 % t= 0 % t= 30 % • CSF Pulsatility increases 2.3 times than normal in hydrocephalic case • ICP increases by a factor of four in hydrocephalic case Quantitative Prediction of Drug Distribution Boundary Conditions Prediction of treatment volume in a 2D coronal cut of a human brain using NGF as drug Estimation of Penetration Depth Site-specific drug delivery • Higher Treatment Volumes were realized for high flow Infusion at the thalamus • The total treatment volume at the end of 4 weeks was found to be 0.107 cc Conclusions Acknowledgements • Dr. Richard Penn, University of Chicago • BRIC, University of Chicago • Fluent Inc, Lebanon, NH • Materialise Inc, Ann Arbor, MI • ImageJ, NIH, MD. • Accurately reconstruction of the human brain geometry to quantify transport processes. • A novel method for extracting transport and reaction constants from experimental data was presented based on TKIP • Prediction of treatment volumes based on site-specific drug delivery for NGF was presented. • Accurate quantification of CSF flow and Intracranial pressure fields. • Validation of CFD simulations with Cine Phase MRI measurements at select regions of the ventricular system.