Download
1 / 28
280 likes | 426 Views
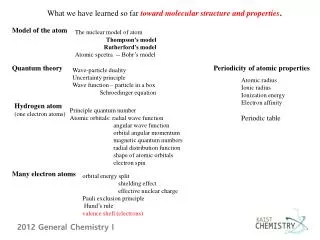
A Spectrally Explicit Optical Model of Attenuation for Seagrasses: And what we learned from it!. L.K. Dixon, E.R. Hall, and G.J. Kirkpatrick April 21, 2009. Why?. ‘PAR’ counts all photons Not all wavelengths created ‘equal’ Chlorophyll (green), only absorbs blue, red

E N D
A Spectrally Explicit Optical Model of Attenuation for Seagrasses: And what we learned from it! L.K. Dixon, E.R. Hall, and G.J. Kirkpatrick April 21, 2009
Why? • ‘PAR’ counts all photons • Not all wavelengths created ‘equal’ • Chlorophyll (green), only absorbs blue, red • Complex “competition” for light • Water column (red) • CDOM, detritus (blue) • Chlorophyll (blue, red) • Epiphytes (like chl?, like detritus?) • Seagrasses (like chl)
Model (Kirk, 1981): Kd = a function of total absorption (at) and scattering (b), empirical, validated with rad. trans. modeling b, at = aw + ag + aph + ad, as functions of color, chl, turbidity Compute Kd for each wavelength attenuate over depth sum photons between 400-700nm to get PAR calculate an overall, spectral Kd Compare to Kd field
1.2 Water 1.0 Color Chlorophyll 0.8 Turbidity Absorption (m-1) 0.6 Sum 0.4 0.2 0.0 400 450 500 550 600 650 700 Wavelength (nm)
3.5 8 7 3.0 6 2.5 Kd 5 2.0 Light, Light Surface 4 Spectral Kd (m-1) 1.5 3 Depth z 1.0 2 0.5 1 0.0 0 400 450 500 550 600 650 700 Wavelength (nm)
5 4 3 2 1 0 0 1 2 3 4 5 1997-1998 data y = 1.023 x + 0.005 r2 = 0.83 n = 99 Limits 17 NTU 143 ug/l 200 PCU Field Kd (m-1) Spectral Kd (m-1)
2002-2006 5 4 3 Field Kd (m-1) 2 1 0 0 1 2 3 4 5 Spectral Kd (m-1)
2002-2006 5 4 3 Field Kd (m-1) Shallow Color > 200 PCU? Clouds? Upper water column? Diffuse sunlight? 2 1 0 0 1 2 3 4 5 Spectral Kd (m-1)
Standard Procedure: Measure light as PAR over all or part of water column…. compute KdPAR = - ln( I / Io ) / depth %PAR at any depth z = 100% * exp( -Kd * z)
6.0 4.0 2.0 0.0 400 500 600 700 ) -1 Absorption (m Wavelength (nm)
Depth Blue Green Red PAR Kd • 0 1000 1000 1000 3000 • 99% / m 25% / m 50% / m • 1 10 750 500 1260 0.87 • 2 0.1 562 250 812 0.65 • 0.001 421 125 546 0.57 • (0.40)
Depth Blue Green Red PAR Kd • 0 1000 1000 1000 3000 • 99% / m 25% / m 50% / m • 1 10 750 500 1260 0.87 • 2 0.1 562 250 812 0.65 • 0.001 421 125 546 0.57 • (0.40)
Depth Blue Green Red PAR Kd • 0 1000 1000 1000 3000 • 99% / m 25% / m 50% / m • 1 10 750 500 1260 0.87 • 2 0.1 562 250 812 0.65 • 0.001 421 125 546 0.57 • (0.40)
Depth Blue Green Red PAR Kd • 0 1000 1000 1000 3000 • 99% / m 25% / m 50% / m • 1 10 750 500 1260 0.87 • 2 0.1 562 250 812 0.65 • 0.001 421 125 546 0.57 • (0.40)
Depth Blue Green Red PAR Kd • 0 1000 1000 1000 3000 • 99% / m 25% / m 50% / m • 1 10 750 500 1260 0.87 • 2 0.1 562 250 812 0.65 • 0.001 421 125 546 0.57 • (0.40)
Depth Blue Green Red PAR Kd • 0 1000 1000 1000 3000 • 99% / m 25% / m 50% / m • 1 10 750 500 1260 0.87 • 2 0.1 562 250 812 0.65 • 0.001 421 125 546 0.57 • (0.40)
KdPAR Depth Int. Computed PAR at 1.5m 0.87 0-1 27% 0.65 0-2 37% 0.57 0-3 42% 0.40 2-3 55%
%PAR at Target Depth 70 60 Z > T.D. 50 40 from Kd at z 30 Z < T.D. 20 10 0 0 10 20 30 40 50 60 70 from Kd at Target Depth
!!!!!!! Measured (or modeled) Kd-PAR values from one depth cannot be used to calculate %PAR at other depths without substantial and systematicerror Errors are magnified when color is high and as the depth difference increases Must measure (or model) spectrally explicit light at the depth, and sum to compute PAR-equivalent values
Model Capabilities Allows computation of • %PAR at any depth • Account for epiphyte attenuation • Account for PUR, seagrass absorption and maximum photosynthesis
2.5 2.0 z 1.5 Light, Light ze 1.0 0.5 0.0 400 450 500 550 600 650 700 Wavelength (nm)
2.5 1.0 2.0 0.8 z 1.5 0.6 Light, Light ze Chlorophyll Absorption 1.0 0.4 0.5 0.2 PUR 0.0 0.0 400 450 500 550 600 650 700 Wavelength (nm)
2.5 1.0 2.0 0.8 1.5 0.6 z Light, Light, Light Chlorophyll Absorption ze 1.0 0.4 zePUR 0.5 0.2 PUR 0.0 0.0 400 450 500 550 600 650 700 Wavelength (nm)
2.5 2.0 1.5 z Light, Light, Light ze 1.0 zePUR 0.5 0.0 400 450 500 550 600 650 700 Wavelength (nm)
Mod. %PAR at Target Depth (%) Segment Modeled %PAR at TD, 2003-2007 60 50 40 30 20 10 0 TPR TMR WW EW LCH CHZ
Next Actions: Robust optical model, powerful tool, improved over reg. models Can calculate %PAR at any depths with WQ data Refine water quality targets Compare modeled PAR, PUR with transect depths, area trends
Acknowledgments: Funding was provided equally by the Charlotte Harbor Estuary Program and the Mote Scientific Foundation. Invaluable assistance provided by: Nichole Becker, Camia Charniga, Jim Culter, Ari Nissanka, Maya Dobrzeniecka, Judy Ott, Joanne Vernon, Dale Dixon, Jeff Flowers, Brad Pederson, Rusty Holmes, Mike Wessel, Keith Kibbey, Andy Konopaki, Emi Rendon, and the many Mote Marine interns