Download
1 / 15
150 likes | 157 Views
Automatic Clustering of Win32 Applications Based on Failure Behavior. Archana Ganapathi Andrew Zimdars University of California, Berkeley CS 294-4: RADS Final Presentation. Project Overview. Goal: partition/cluster applications based on their failure behavior Why?

E N D
Automatic Clustering of Win32 ApplicationsBased on Failure Behavior Archana Ganapathi Andrew Zimdars University of California, Berkeley CS 294-4: RADS Final Presentation
Project Overview • Goal: partition/cluster applications based on their failure behavior • Why? • Provide users with a “likely frustration factor” at the point of installing a new app • What underlying design principles determine good/bad applications? • What application features guide application crash behavior?
Raw Data • Crash event timestamp • Machine ID, user ID • Failed application name and version • Failed DLL name and version • Application error code • Calculated values: • Time interval between consecutive crashes for (applicationName, machineID) pair • “Crash clusters”: sequence of consecutive crashes of the same app in a short period of time (10 minutes)
Supplemental Features • Usage Data • Based on survey of users whose machines crashed • DLL support for each application • Used “Dependency Walker” http://www.dependencywalker.com/
Derived Features • Time since previous crash normalized by average time between crashes on machine • Time since previous cluster normalized by average time between clusters on machine • Size of crash cluster • Time between events in a crash cluster • Frequency of crash normalized by frequency of usage • Complexity of application (# of dlls) • Specific dlls used • Crashing dlls for app
App1 App2 App3 Crash Behavior on a Machine time
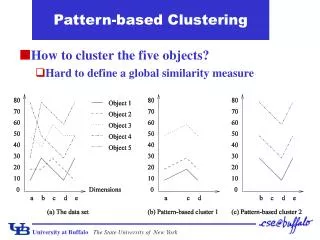
Clustering Algorithms (1) Purpose: To reveal structure in data set by approximately finding groups of data points that are closer to each other than to other groups
Clustering Algorithms (2) • k-means clustering: • Final clusters sensitive to initial choice of cluster centers • Doesn’t provide much information about structure within clusters • Agglomerative clustering: • Deterministic operation (but deterministic-annealing variants possible) • Algorithm results in binary cluster “tree” (pairs of clusters successively merged) • Greedy clustering can lead to odd groupings
Challenges of non-numeric data • Clusters sensitive to choice of scale • Impossible/meaningless to instantiate “average” data point for many data types: • Strings: discrete values, and order irrelevant to domain structure • Sets (e.g. of DLL names): no natural ordering • Version numbers: order irrelevant to domain structure • Hexadecimal error codes: non-ordinal when used as crash labels • Numerical vectors have “natural” difference (vector subtraction) and metrics (Lp) but non-numeric components require “unnatural” difference operation • Strings:d(s1, s2) = 0 iff s1 = s2; d(s1, s2) = 1 otherwise • Sets:d(s1, s2) = |(s1 \ s2) (s2 \ s1)| (size of symmetric difference) • Version numbers: Component-wise difference scaled so difference between minor version numbers doesn’t dominate difference between major version numbers • Vectors with mixed numeric and non-numeric components should still satisfy triangle inequality (artificial distance should be a metric)
Clustering Results: Raw Clusters • Initial clusters correspond to single-application crash clusters • Same user/machine/application/DLL • Larger clusters aggregate per-application crashes across machines • Common: Error codes specific to crash clusters • Uncommon: Same DLL causes an application to crash on two different machines • Rare: Same DLL causes an application to crash on two different machines with the same error code! • Analytical challenges • Most users stick to one computer: doubles effective weight of machine in assigning clusters • Feature expansion mostly application-specific: multiplies effective weight of application in assigning clusters • Sparse data • Pathological environment (cf. crashes of Lisp and Java IDEs)
Clustering Results: Sensitivity Analysis • Make one dimension at a time twice as important as the others, and observe the effect on cluster membership • Machine-specific properties • Affect order of cluster formation • Consistent basis for forming initial (small) clusters • Strong effect, but not overwhelming • Application-specific properties • DLL set discriminates between statically- and dynamically-linked apps, but not between “simple” and “complex” • Most apps use the same set of (system, VC++) runtime DLLs
Clustering Results: Application Features Only • Initial results show clusters corresponding to crash series • Do our raw data overweight machine/user identifiers? • Lower-dimensional space fights sparsity • Standouts: • MS Office crashes cluster together (same DLLs) • Research apps cluster together (similar crash patterns, static linking) • Alisp and Firefox (!): some crashes in both caused by same DLL (but different error codes) • Other clusters: • “Complex” applications that hang (but not Firefox/Thunderbird) • Matlab and Internet Explorer (similar DLL sets: Matlab = IE + LAPACK?) • Network apps (IE, Netscape, Y! Messenger, Outlook, Acrobat Reader)
DLLs: Model citizens and bad apples • 227 dlls used by 33 apps analyzed • 37 of these dlls caused crashes in our data set • Worst offenders (widely used and frequent causes of crashes): ntdll.dll, kernel32.dll, msvcrt.dll • 190 model citizens • Random sample of (almost) universally used dlls that have not produced crashes:
Crash Data and Application Structure • Clusters should reflect relevant structure in data set • Distance between data points: • Irrelevant: Edit distance between two app names (e.g. “mozilla.exe” and “iexplore.exe”) • Irrelevant: Order of hexadecimal error codes • Relevant: Agreement/disagreement of two app names • Introduction of derived features that express application complexity, usage patterns: • Static processing identifies DLL support of application • Time between crashes and “crash clusters” • Scaling dimensions of vector space to “normalize” contribution of different factors • Normalization easy way to perform “sensitivity analysis” of clusters: “What if the DLL that caused the crash were twice as important as all other features?” • Consider the relative effect of t in milliseconds vs. t in days vs. t/max(t)
Conclusion: The Blame Game • Most crash histories machine/user-specific • Configuration management more important than blaming (insert victim here)? • From patterns to testable hypotheses: Statistical significance of analysis? • Trustworthy patterns require huge amounts of structured data • Tradeoff between introducing domain knowledge and biasing results to confirm hypotheses • Crash patterns are not usage patterns