Download
1 / 19
190 likes | 350 Views
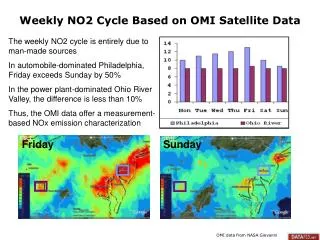
OMI Tropospheric NO2 from Lightning in Observed Convective Events. Ken Pickering – NASA Goddard Eric Bucsela – UMBC/GEST, NASA/GSFC Tom Kucsera – UMBC/GEST, NASA/GSFC Laura Pan - NCAR Chris Davis - NCAR James Gleason – NASA Goddard Pieternel Levelt - KNMI. Introduction.

E N D
OMI Tropospheric NO2 from Lightning in Observed Convective Events Ken Pickering – NASA Goddard Eric Bucsela – UMBC/GEST, NASA/GSFC Tom Kucsera – UMBC/GEST, NASA/GSFC Laura Pan - NCAR Chris Davis - NCAR James Gleason – NASA Goddard Pieternel Levelt - KNMI
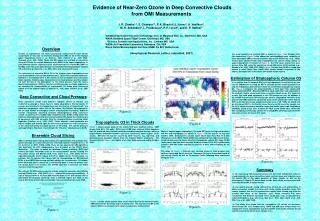
Introduction • Lightning produces ~15% of total NOx emissions. • Most likely global LNOx production is 2 – 8 TgN/yr (Schumann and Huntrieser, 2007, ACP). • Most of lightning-produced NOx injected into middle and upper troposphere; important for UT ozone production, especially in tropics. • Previous satellite lightning NO2 (LNO2) analyses: Events: Richter and Burrows (2002); Thomas et al. (2003); Beirle et al. (2004; 2006) Global: Boersma et al. (2005), Martin et al. (2007) • This analysis uses OMI tropospheric NO2 to obtain estimates of LNOx production in specific convective events over the Central USA.
Procedure • Cases of possible NO2 from lightning (LNO2) downstream of observed storms identified from NASA standard retrieval tropospheric NO2 data sets • OMI data screened for 100% cloud cover for days of interest • NO2 profile shapes from cloud-resolved modeling of midlatitude storms with lightning used in estimating appropriate AMFs • Background (pollution, soil NOx, lightning from other storms) is removed by subtracting monthly mean LNO2 = (OMINO2trop – OMINO2tropMonthlyMean) x (AMFGEOS-Chem / AMFlightning) • Estimate LNOx by assuming that LNO2 is 30% of LNOx in 500 – 200 hPa layer.
Procedure (continued) • Run set of back trajectories starting at 500, 300, and 200 hPa with 1 x 1 degree separation from region of enhanced OMI NO2 from time of OMI overpass, and count upstream NLDN CG flashes in 1 x 1 degree grid boxes. Assume decay rate equivalent to 3.5-day NOx lifetime in UT. • Obtain vertically weighted average number of upstream CG flashes using vertical profile of LNOx from prior cloud-resolved model simulations. • Adjust CG flash counts for NLDN detection efficiency of ~90%. • Scale up the CG flash counts to total flashes using the Boccippio et al. (2001) IC/CG ratio climatology. • Divide estimates of moles of LNOx in enhanced region by number of total upstream flashes to obtain average moles/flash
LNO2 profile from UMD Cloud Chemistry Model averaged over simulations for three midlatitude storms Profile representative of outflow 100 km downwind of storm core With 40% cloud cover: AMF with GEOS-Chem NO2 profile ~ 0.9 AMF with anvil outflow NO2 profile ~ 2.0
Case 1: June 3, 2005 Cloud Cover Level 2 OMI Tropospheric NO2 1.64 +/- 0.617 x 10⁶ moles NO2 2.35 +/- 0.618 x 10⁶ moles NO2 After removal of pixels with 100% cloud cover LNO2 on 0.25 x 0.25 degree grid
Case 1: June 3, 2005 0000-0100 UT 0600-0700 UT 1200-1300 UT 1800-1900 UT
Case 1: Calculations Upstream CG Flashes: Using LNOx mass profile from 500 hPa 1724 midlatitude cloud-resolved simulations: 300 3031 200 1750 Vertically mass-weighted upstream CG flashes = 2163 Scaling up to total flashes using detection efficiency of 90% and mean IC/CG ratio = 6 for region of upstream flashes yields 16,827 flashes Boccippio et al., 2001
Case 1: Calculations Scaling up to NOx from NO2: 2.35 x 10⁶ moles NO2 x 1 mole NOx/0.3 moles NO2 = 5.47 x 10⁶ moles NOx Estimating average moles NOx per flash: 7.83 x 10⁶ moles NOx / 16827 flashes = 465 +/- 122 moles NOx/flash Large source of uncertainty Effective Cloud Fraction
Case 2: June 22, 2006 - Oklahoma Cloud Cover Level 2 OMI Tropospheric NO2 1.33 +/- 0.519 x 10⁶ moles NO2 1.91 +/- 0.522 x 10⁶ moles NO2 After removal of pixels with 100% cloud cover LNO2 on 0.25 x 0.25 degree grid
Case 2: Calculations Upstream CG flashes: 500 hPa 540 300 794 200 1610 Vertical mass weighting and detection efficiency correction yields 868 CG flashes Scaling up to total flashes using mean IC/CG ratio of 4 for upstream region yields 4339 total flashes Scaling from NO2 to NOx: 1.33 x 106 x 1 mole NOx/0.3 moles NO2 = 4.43 x 10⁶ moles NOx Estimating moles LNOx per flash: 4.43 x 10⁶ moles NOx/4339 flashes = 997 +/- 389 moles NOx/flash Cloud Cover
Case 3: June 22, 2006 Missouri 2.47 +/- 0.653 x 10⁶ moles NO2 LNO2 on 0.25 x 0.25 degree grid Effective Cloud Fraction AMFGEOSChem AMFlightning
Case 3: Calculations Vertical mass weighting and detection efficiency correction yields 2413 CG flashes Upstream CG flashes: 500 hPa 1824 300 2145 200 3473 Scaling up from CG to total flashes using mean IC/CG ratio of 4 for upstream region yields 12,066 flashes Scaling up from NO2 to NOx: 2.47 x 106 x 1 mole NOx/0.3 moles NO2 = 8.23 x 10⁶ moles NOx Estimating average moles per flash: 8.23 x 10⁶ moles NOx/12066 flashes = 682 +/- 180 moles NOx/flash Average over 3 cases: 715 +/- 215 moles NOx/flash
Lightning NO Production Scenarios Summary of Five Simulated Storms OMI: 3 US storms * Orville et al., 2002 Means: 500 moles/flash 0.94 ratio
Summary • Cases of LNOx detected in OMI tropospheric NO2 data over Central U. S. • Employed AMFs appropriate for convective outflow regimes containing LNOx. These AMFs are approximately a factor of 2 larger than those from GEOS-Chem used in the standard retrieval. • Estimates of LNOx production for 3 cases range from 465 to 997 moles/flash (mean = 715 moles/flash with 25-40% OMI retrieval uncertainty). This is at the high end of other recent continental US estimates. • Main uncertainties: radiative transfer in substantial cloud cover, magnitude of tropospheric background NO2 column, IC/CG ratio. • OMI-based estimates, cloud-resolved modeling, and GEOS-Chem simulations all suggest NO production/flash in US > global mean
Future • Refine LNOx production estimates for these three cases: Oklahoma case – likely can obtain actual IC/CG ratio from 3-D Lightning Mapping Array data Run trajectories with higher-resolution data from WRF • Conduct similar analyses with OMI data for Northern Australia and Costa Rica regions: Aircraft data available from SCOUT-O3/ACTIVE and NASA TC4 field experiments Cloud-resolved modeling for specific events from these experiments is underway or will be conducted in the near future Do tropical lightning flashes make less NOx per flash than midlatitude flashes?