Download

1 / 23
230 likes | 394 Views
What is Important in Study Design? And Why?. Roxy Peck Cal Poly San Luis Obispo rpeck@calpoly.edu. Study Design in the Common Core. 7.SP.1

E N D
What is Important in Study Design? And Why? Roxy Peck Cal Poly San Luis Obispo rpeck@calpoly.edu
Study Design in the Common Core 7.SP.1 Understand that statistics can be used to gain information about a population by examining a sample of the population; generalizations about a population from a sample are valid only if the sample is representative of that population. Understand that random sampling tends to produce representative samples and support valid inferences. S-IC.3 Recognize the purposes of and differences among sample surveys, experiments, and observational studies; explain how randomization relates to each. S-IC.6 Evaluate reports based on data.
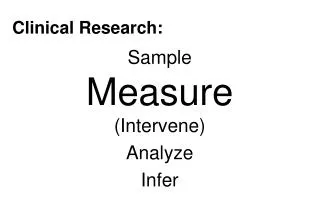
Important Theme Our ability to draw conclusions from data depends on how the data are collected.
Two Types of Statistical Studies • Observational Studies Purpose: To learn about a population Requires: Representative sample To the Rescue: Random selection • Experiments Purpose: To learn about the effect of an explanatory variable on some response variable Requires: Comparable groups To the Rescue: Random assignment
Why do we??? • Why do we intentionally introduce “randomness” when we collect data? • Drawing conclusions in statistical studies usually involves answering the question “Could this have happened by chance?”
When we introduce randomness in a planned way… • We know what “just by chance” looks like! • This allows us to recognize results that are “unusual” if chance is the only thing going on.
Random Selection in Sampling • Goal: Representative sample • Activity: Show Me the Money (Thanks to Doug Tyson for sharing this activity and the next activity.)
Show Me the Money Population: Top 200 Movies from 2011 • Pick 10 movies from the list that you saw or wanted to see. • Record the title and the gross income for each of these 10 movies. • Calculate the mean for this sample of 10 movies.
Discussion Questions • Did everyone get the same sample mean? • Why? Sampling variability: Different samples tend to produce different results.
Question Is the way you selected the sample of 10 movies a good method? Do you think that it resulted in a sample that is representative of the population?
Random Sampling • Use your calculator to generate 10 random numbers between 1 and 200. • Record the title and gross income for the 10 movies corresponding to these random numbers. • Calculate the mean for this sample of movies.
Discussion And the point of this activity is…
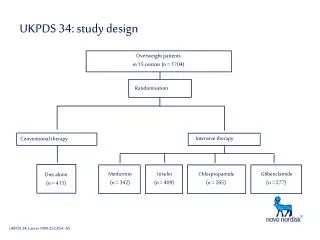
Random Assignment in Experiments • Goal: Comparable groups • Activity: Does SpongeBob Make Kids Dumber? Reference: “The Immediate Impact of Different Types of Television on Young Children’s Executive Function”, Pediatrics, 2011.
The Experiment • Assigned 60 children to one of three groups: • Cartoon (SpongeBob) • Educational cartoon • Drawing • After 9 minutes, children were given several tests that measured executive function (self-regulation, working memory). • Findings: SpongeBob groups scored significantly lower than the other two groups.
Does it Matter?? • Does it matter how the groups are created? • Let’s see. • Group of 14 children from a list that is in alphabetical order. • Information for each subject—name, IQ, gender
Creating groups • Create 2 groups • SpongeBob • Drawing • Put first seven children into SpongeBob group. What do you notice? • Why might this be a problem?
Now Try Random Assignment • Mix the cards and then divide into two groups of seven. • For each group, calculate the mean IQ and the proportion of females. • Calculate the difference in mean IQ for the two groups.
So What is the Point? • What can we conclude about random assignment?
Implications for Drawing Conclusions from Statistical Studies • Random Selection • Produces representative samples • Allows us to generalize to population • Random Assignment • Produces comparable groups • Allows us to conclude that treatment is cause of observed effect
Thank You! Thank you for your participation in this session. For copies of the slides, email to rpeck@calpoly.edu