Download
1 / 22
220 likes | 361 Views
“Exploring High-D Spaces with Multiform Matrices and Small Multiples”. MacEachren, A., Dai, X., Hardisty, F., Guo, D., and Lengerich, G. Proc. IEEE Symposium on Information Visualization (2003), 31–38. http://www.geovista.psu.edu/. Mudit Agrawal Nathaniel Ayewah. The Plan. Motivation

E N D
“Exploring High-D Spaces with Multiform Matrices and Small Multiples” MacEachren, A., Dai, X., Hardisty, F., Guo, D., and Lengerich, G. Proc. IEEE Symposium on Information Visualization (2003), 31–38. http://www.geovista.psu.edu/ Mudit Agrawal Nathaniel Ayewah
The Plan • Motivation • Contribution • Analysis Methods • GeoVISTA studio • Conclusions
Motivation • Discover Multivariate relationships • Examine data from multiple perspectives DATA INFORMATION
Contribution • Visual analysis of multivariate data • Combinations of scatterplots, bivariate maps and space-filling displays • Conditional Entropyto identify interesting variables from a data-set, and to order the variables to show more information • Dynamic query/filtering called Conditioning
Contribution • Back-end: Design Box Building of applications using visual programming tools • Front-end: GUI Box Visualizing data using the developed designs Source: GeoVista Studio
Sorting Analysis Methods • Nested sorting – sort a table on selected attributes • To understand the relationships between sorted variables and the rest • Permutation Matrix : • cell values are replaced by graphical depiction of value. • Rows/cols can be sorted to search for related entities • e.g.
Sorting Analysis Methods • Augmented seriation: • Organizing a set of objects along a single dimension using multimodal multimedia • Correlation matrices • Reorderable Matrices: • Simple interactive visualization artifact for tabular data Source: (Siirtola, 1999)
Space-filling visualization Analysis Methods Mosaic plot Sunburst methods Source: (Schedl, 2006) Source: (Young, 1999) Pixel-oriented methods Source: (Keim, 1996)
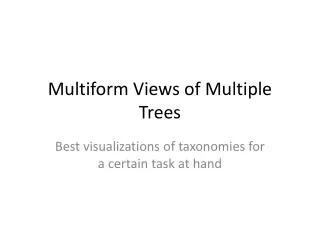
Multiform Bivariate Small Multiple Analysis Methods • Small Multiples A set of juxtaposed data representations that together support understanding of multivariate information Source: (MacEachren, 2003)
Multiform Bivariate Matrix Analysis Methods Source: (MacEachren, 2003)
Demonstration • Basic Demo • Application construction • Scatterplot, Geomap • Dynamic linking, eccentric labeling etc.
High Dimensionality • Interactive Feature Selection • Guo, D., 2003. Coordinating Computational and Visualization Approaches for Interactive Feature Selection and Mulivariate Clustering. Information Visualization 2(4): 232-246.
High Dimensionality • “Goodness of Clustering” • high coverage • high density • high dependence • E.g. • Correlation • Chi-squared • Conditional Entropy HIGH HIGH LOW
1 2 3 4 1 2 Conditional Entropy • Discretize two dimensions into intervals • Nested Means mean mean mean Source: (Guo, 2003)
Conditional Entropy Source: (Guo, 2003)
Ordering Dimensions • Related dimensions should be close together Sort Method: Minimum Spanning Tree Sort By: Conditional Entropy A 5 B 9 15 16 21 C D 4 Ordering: B A D C unsorted
Demonstration • Advanced Demo • Interactive Feature Selection • PCP, SOM, Matrix • Conditioning
Conclusions • Strengths • Dynamic Linking of different representations • Visualizing clusters of dimensions • Rich and extensible toolbox • Weaknesses • Usability • Arrangement of Windows
References • Guo, D., (2003). Coordinating Computational and Visualization Approaches for Interactive Feature Selection and Mulivariate Clustering. Information Visualization 2(4): 232-246. • Keim, D (1996) Pixel-oriented Visualization Techniques for Exploring Very Large Databases, Journal of Computational and Graphical Statistics. • Schedl, M (2006), CoMIRVA: Collection of Music Information Retrieval and Visualization Applications. Website. http://www.cp.jku.at/people/schedl/Research/Development/CoMIRVA/webpage/CoMIRVA.html • Siirtola, H. (1999), Interaction with the Reorderable Matrix. In E. Banissi, F. Khosrowshahi, M. Sarfraz, E. Tatham, and A. Ursyn, editors, Information Visualization IV '99, pages 272-277. Proceedings International Conference on Information Visualization. • Young, F (1999), Frequency Distribution Graphs (Visualizations) for Category Variables, unpublished. http://forrest.psych.unc.edu/research/vista-frames/help/lecturenotes/lecture02/repvis4a.html.