Download
1 / 60
600 likes | 603 Views
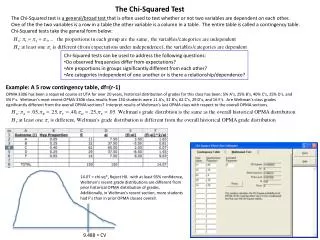
ASSOCIATION BETWEEN VARIABLES:TABLE PERCENTAGING. Topic #12. VOTE by RELIGION. Let us consider the following hypothesized association: RELIGIOUS AFFILIATION ==> PRESIDENTIAL VOTE [ inds ] (Protestant vs. Catholic) (Dem. vs. Rep.)

E N D
VOTE by RELIGION • Let us consider the following hypothesized association: RELIGIOUS AFFILIATION ==> PRESIDENTIAL VOTE [inds] (Protestant vs. Catholic) (Dem. vs. Rep.) • Note the variables do not have “matching values,” so we cannot characterize the hypothesis in positive vs. negative terms. • However, the expectation until about 40 years ago would be that (outside of the South) Catholic tend to vote Democratic and Protestants tend to vote Republican. • Suppose we collect appropriate data and run the crosstabulation, and that it looks like the following table.
VOTE by RELIGION (cont.) • The difference between this 2x2 table and those we examined earlier (WHETHER/NOT VOTE by INTEREST) is that this table does not have uniform marginal frequencies. [See =>] • Does this crosstabulation display an association between the two variables? • Perhaps the prior question is: given these (non-uniform) marginal frequencies, what would zero association between VOTE and RELIGION look like?
Uniform vs. Non-Uniform Marginals • In the VOTE by INTEREST example with uniform marginal frequencies, we saw than a zero association meant that cases are uniformly distributed (“evenly spread”) over the four (interior) cells of the table. • But we cannot have such a simple pattern here because the rows and columns must add up to the specified (non-uniform) marginal frequencies.
VOTE by RELIGION (cont.) • Given these non-uniform marginal frequencies, what would the crosstabulation look like if there were no association between RELIGION and VOTE?
VOTE by RELIGION (cont.) • The sample as a whole (i.e., the set of 1000 cases) is divided 60% to 40% between Democratic and Republican voters. • In the event RELIGION has no association with (and no apparent influence on) VOTE, we would expect that Protestants and Catholics would vote Democratic vs. Republican, not (necessarily) in a 50%-50% proportion, but in the same proportion as each other (and therefore in the same proportion as the population as a whole). • that is, that 0.6 × 650 = 390 Protestants would vote Democratic and 0.4 × 650 = 260 would vote Republican; and • that 0.6 × 350 = 210 Catholics would vote Democratic and 0.4 × 350 = 140 would vote Republican.
VOTE by RELIGION (cont.) • It is also true that the sample as a whole is divided 65% to 35% between Protestants and Catholics. • In the event VOTE has no association with (and apparently is not influenced by) RELIGION, we would expect that the Democratic and Republican voters would be Protestants and Catholics, not in necessarily in a 50%-50% proportion, but again in the same proportion as each other (and as population as a whole as each other); that is, • 0.65 × 600 = 390 Democratic voters would be Protestants and 0.35 × 600 = 210 would be Catholic; and • 0.65 × 400 = 260 Republican voters would be Protestants and 0.35 × 400 = 140 would be Catholics. • These two sets of calculations both produce the same expected frequencies shown in Table 1B. • SPSS can calculate and display expected frequencies in any crosstabulation.
VOTE by RELIGION (cont.) • A third way of determining these expected frequencies is to note that • 60% of all respondents vote Democratic, and • 65% of all respondents are Protestants, so • if there is no association between the variables, • 60% x 65% = 39% of the 1000 respondents would be Protestants who vote Democratic, • and likewise for the other cells. • These are expected relative frequencies. • Given Table 1B displaying expected frequencies in the absence of association, we can see that Table 1A shows that there are in fact • more cases in the Dem-Cath and the Rep-Prot cells, and conversely • fewer cases in the Dem-Prot and Rep-Cath cells, • than would be the case if there were zero association. • So we can conclude that • there is an association between the variables, and • its direction is this: Catholics vote Democratic more than Protestants do (or the general population does) and Protestants vote Republican more than Catholics do (or the general population does).
VOTE by RELIGION (cont.) • How strong is this association between RELIGION and VOTE? This is equivalent to asking where Table 1A stands in relation to Table 1B showing zero association and a table showing maximum association between the variables. • In the VOTE by INTEREST example that introduced Handout #10, a maximum association was exemplified by a table in which everyone with high interest votes and no one with low interest votes. • By the same token, it might seem that if there were a maximum association between RELIGION and VOTE (in the specified direction), every Catholic would vote Democratic and every Protestant would vote Republican. • But this cannot occur, since there are 650 Protestants but only 400 Republican voters, so at most 400 Protestants can vote Republican. • Table 1C shows the maximum possible association between in the variables the same direction exhibited in Table 1A.
VOTE by RELIGION (cont.) • If there were no association, there would be 210 cases in the Dem-Cath cells (Table 1B); if there were maximum association, there would be 350 cases in the Dem-Cath cells (Table 1C). • In fact, there are 300 cases in the Dem-Cath cells (Table 1A), so in this sense Table 1A stands between Table 1C than to Table 1B, so a measure of association would be less than 1 but greater than 0. • Furthermore Table 1A looks “closer” to Table 1C than Table 1B, so we might expect a measure of association to have a value somewhat closer to 1 than to 0, i.e., somewhat greater than 0.5.
VOTE by RELIGION (cont.) • Let’s also consider what a table would look like if it displayed a maximum association between the variables but in the opposite direction. • The VOTE by INTEREST example suggests that this would mean every Catholic votes Republican and every Protestant votes Democratic. • But again this cannot occur, since there are 650 Protestants but only 600 Democratic voters, so at most 600 Protestants can vote Democratic. • Table 1D shows maximum possible association between in the variables in the opposite direction from that exhibited in Tables 1A and 1C.
Column Percentages • If all this seems a bit confusing, you will glad to learn that there is another more intuitive and much more transparent way to “see” association (and its direction and strength) in a crosstabulation. • This is accomplished by converting the absolute frequencies (or case counts) we have been working with into the appropriate kind of adjusted relative frequencies (or valid percents). • In particular, the existence, direction, and strength of the association between RELIGION and VOTE becomes immediately apparently when we convert Table 1A into the following variant.
Column Percentages (cont.) • We have replaced each absolute frequency with its column percentage. • For example, the 46% in the Dem-Prot. cell tells us that 300 is 46% of column total of 650 — substantively that 46% of all Protestants vote Democratic. • More generally, each set of column percentages shows relative frequencies with respect to the dependent (row) variable for a given value of the independent (column) variable. • If column percentages are about the same across all columns, we infer that the independent variable has little or no apparent influence on, or association with, the dependent variable. • If column percentages differ substantially from column to column, we infer that the independent variable has substantial apparent influence on, or association with, the dependent variable, and the direction and strength of that association is revealed by the nature of the column to column differences.
Column Percentages (cont.) • Especially in a 2×2 table like Table 1E, the apparent influence of the independent variable on the dependent variable, or the association between them, can be summarized by the percentage difference between columns: • in this case, by saying that Catholics are 40 percentage points more likely to vote Democratic than Protestants are (or, equivalently, that Protestants are 40 percentage points more likely to vote Republican than Catholics are). • Calculating column percentages for Table 1C shows that Catholics could be at most 68 percentage points more likely to vote Demo-cratic than Protestants are • Calculating column percentages for Table 1D shows that Protes-tants could be at most 92 percentage points more likely to vote Democratic than Catholics are.)
Column Percentages (cont.) • One potential (and, unfortunately, often actual) source of confusion concerning table percentages is that, given a “two-dimensional” (cross) tabulation, there are two — indeed, actually three — sets of totals on which percent-ages may be based. Table 1E shows only one of these, i.e., column percentages. • Column percentages are based on the total number of (valid) cases in each column. Therefore column percent-ages add up to 100% in each column. Column percent-ages answer this question: of all cases that have a particular value with respect to the column (independent) variable, what is their relative frequency distribution with respect to the row (dependent) variable.
Row Percentages • Row percentages are based on the total number of (valid) cases in each row. • Therefore row percentages add up to 100% in each row. • Row percentage answer this question: of all cases that have a particular value with respect to the row (dependent) variable, what is their relative frequency distribution with respect to the column (independent)variable.
Total Percentages (cont.) • Total percentages are based on the total number of (valid) cases in the whole table, • Therefore total percentages add up to 100% in the whole table. • Table percentages answer this question: of all cases in the table, what percent of them have a particular combination of values with respect to the row and column variables.
Table Percentages • Normally, a table title does not explicitly say “Column [etc.] Percentages.” • However, the table should show clearly what kind of percentages it is reporting. • This is best done by • a “total” row at the bottom of the columns, or • a “total” column at the end of each row, or • or a grand total cell in the “southeast’ corner of the table • that shows percentages adding up to 100% (perhaps with rounding error) in one or other direction or overall, and thereby making it clear what type of percentages the table is displaying. • For reasons discussed below, such a table should also show the number of cases constituting each 100%.
Table Percentages (cont.) • Most commonly a crosstabulation is constructed to address a question of this type: what impact (or influence) does (variation in) the independent variable have on the distribution of values with respect to the dependent variable? (e.g., “what influence does religion have on voting behavior?”). • As we have previously noted, by convention the independent variable is usually made the column variable in a crosstabulation. • Therefore, it is column percentages that answer such questions, and crosstabulations most commonly display column percentages.
Presidential Approval • “Do you approve or disapprove of the way George W. Bush is handling his job as President?”
Party Identification “Colors” Presidential Approval (and other opinions)
Table Percentages (cont.) • In contrast, row percentages answer of this type question: when cases are categorized with respect to the their values with respect to the row (dependent) variable, how do these categories differ with respect to column (independent) variable accounted for by the independent variable? (e.g., “how do voting groups differ with respect to religious affiliation?”). • Finally, total percentages answer basically descriptive (rather than cause and effect) questions (that make no distinction between the independent and dependent variables) about how the cases in the population as a whole are distributed among the categories defined by all possible combinations of values on the two variables (e.g., “what percent of all voters are Catholic Democrats?”).
SPSS Table Percentaging • As you would expect, SPSS crosstabulations can display any or all types of table percentages. • Click on Analyze => Descriptive Statistics => Crosstabs • In the Crosstabs dialog box, click on Cells and then check the desired percentages. • If you wish, you can suppress the display of (observed) case counts. • You can also have SPSS calculate and display “expected case counts” or expected frequencies that would result in the absence of association between the variables (such as were displayed in Table 1B). • Some sample SPSS crosstabulations showing all types of percentages follow.
SPSS Table Percentages (cont.) • Suppose we are interested in the influence of IDEOLOGY on PRESIDENTIAL VOTE (#14 in PS #3A and #9) • Here is the basic (case counts/absolute frequencies only) SPSS crosstabulation (with some further editing) based on the 1992 ANES/SETUPS data.
SPSS Table Percentages (cont.) If requested to calculate and display (column, row, or total) percentages, SPSS computes “valid percents” or adjusted relative frequencies. In fact, SPSS (by default) entirely deletes the (shaded) missing data row and column shown above and produces Table 2B displayed on the next page. Note that the total number of cases has been reduced from 2253 to 1600 in the following manner: 2253 total number cases -185 missing on IDEOLOGY - 566 missing on PRESIDENTIAL VOTE + 98 missing on both IDEOLOGY and VOTE so double subtracted above 1600 total number of valid cases (= sum of unshaded cells in Table 2A) The resulting SPSS crosstabulation showing all types of percentages appears on the next page. Note that SPSS labels row percentages as “% within Dependent Variable” and column percentages as “% with Independent Variable.”
Presentation Grade Table • The following standard presentation format for a crosstabulation shows the impact of IDEOLOGY on PRESIDENTIAL VOTE: • The table is given a title of the form DEPENDENT VARIABLE BY INDEPENDENT VARIABLE. • INDEPENDENT VARIABLE = Column Variable. • DEPENDENT VARIABLE = Row Variable • Column Percentages are displayed, explicitly adding up to 100% in each column. • The number of cases in each column are given. • There may be a Total/Overall column at the right margin.
Presentation Grade Table TABLE. PRESIDENTIAL VOTE BY RESPONDENT’S IDEOLOGY I D E O L O G Y VOTELib.S. Lib.Mod.S. Cons.Cons. All Bush 5% 11% 28% 43% 70% 34% Perot 12% 18% 24% 22% 13% 19% Clinton83% 71% 48% 35% 16% 47% Total 100% 100% 100% 100% 99%* 100% (n) (205) (244) (449) (410) (292) (1600) * Rounding Error Source: 1992 SETUPS/ANES Note. I rearranged the rows to put Perot (as a more or less centrist Independent) “between” Bush and Clinton.
TABLE. VOTE BY IDEOLOGY Vote LiberalModerateConser. Dem. 80% 50% 10% Rep. 20% 50% 90% Total 100% 100% 100% (n=250) (n=400) (n=350) What percent of conservatives voted Democratic? What percent of the Democratic vote came from moderates? What percent of the Republican vote came from non-conservatives? What percent of all voters are moderate? What percent of all voters voted Republican? What percent of all voters are liberals who voted Democratic?
TABLE. VOTE BY IDEOLOGY Vote LiberalModerateConser. Dem. 80% 50% 10% Rep. 20% 50% 90% Total 100% 100% 100% (n=250) (n=400) (n=350) What percent of conservatives voted Democratic? [Col.% Q] What percent of the Democratic vote came from moderates? [Row % Q] What percent of the Republican vote came from non-conservatives? [Row % Q] What percent of all voters are moderate? [Total %] What percent of all voters voted Republican? [Total % Q] What percent of all voters are liberals who voted Democratic? [Total % Q]
Recovering Original Cases Counts • Only the first question is a column percent question, the answer for which can be read directly off this column-percent table. • You cannot (directly) answer row or total percent questions from a column percent table. • However, if (and only if) the number of cases corresponding to each 100% column total is given, you can “work backwards” to recover the original case counts (absolute frequencies) in each cell of the table. TABLE. VOTE BY IDEOLOGY Vote LiberalModerateConser. Dem. 80% 200 50% 200 10% 35 435 Rep. 20%50 50%200 90%315 565 Total 100% 100% 100% (n=250) (n=400) (n=350) 1000 • Having done this, you can readily compute any desired (column, row, or total percentage). • This is one reason why the number of cases corresponding to each 100% should be provided. • Another reason is to indicate the sample size and therefore the margin of error for subgroup statistics.
Answering Questions from Crosstabulations • Questions pertaining to crosstabulations are all of this general form: • “Of all cases for which A is true, for what fraction (or percent) of cases is B also true?”, where “A” and “B” refer to values of the variables in the table (though A may refer to all values and thus be true of all cases, i.e., total percent questions). • Here is a (more or less) “fail-safe” step-by-step procedure to answer such questions. • It assumes that you are starting with a crosstabulation displaying case counts/absolute frequencies (or possibly total percentages). • So, if you are presented with a table displaying row or column percentages, you must first (in the manner just described) recover the case counts/absolute frequencies in each cell of the table.
Answering Questions from Crosstabulations (cont.) • First, put a double line (or other distinctive marking) around all the cells of the table for which A is true. • If A refers to all cases in the table, the double line goes around the entire table. • If A refers to all cases with a specified value (or set of values) on the column variable, the double line goes around the appropriate column (or set of columns). • If A refers to all cases with a specified value (or set of values) on the row variable, the double line goes around the appropriate row (or set of rows). • If A refers to all cases with specified combinations of values on the row and column variables, the double line goes around the appropriate cells.
Answering Questions from Crosstabulations (cont.) • Second, shade in (or otherwise indicate) all the cells of the table • which are within the double lines, and • for which B is true (where B, like A, refers to one or more rows, columns, or cells in the table). • Finally, the answer to the question is simply the fraction formed by dividing the number of cases [or the sum of total percentages] in the shaded cells by the number of cases [or the sum of total percentages] in the portion of the table enclosed by double lines. • This fraction can be straightforwardly converted into a percentage by using a calculator (or even paper and pencil). • Many tables, including many SPSS tables, include (a) row and column totals and/or (b) row and/or column and/or total percentages for each cell, which may save you from making calculations. • However the “core” of the table from which everything else can be calculated is the set of case counts (absolute frequencies) in each cell of the table.
Confusing Row and Column Percentages • Debates and commentary concerning public affairs are sometimes off the mark because (in effect) row and column percentages have been confused. Here is a salient example. • After the (first) Gulf War, many news reports noted that about 40% of U.S. battle deaths resulted from “friendly fire,” as opposed to about 5% in WWII, Korea, and Vietnam. • Some commentators drew the inference from this statistic that U.S. military forces had become sloppy or careless. • But our baseline expectation of what percent should be approximately constant from war to war if the compe-tence and discipline of U.S. forces remains approxi-mately constant is not • (1) U.S. friendly-fire deaths as a percent of all U.S. battle deaths suffered, but rather • (2) U.S. friendly-fire deaths as a percent of all U.S. battle deaths inflicted. • Note that the 40% and 5% statistics are of the first type.
Confusing Row and Column Percentages (cont.) • In a roughly balanced conflict in which each side suffers and inflicts about the same number of deaths, (1) and (2) are about the same • But in a highly unbalanced conflict, such as the Gulf War (or the three-week [March 2003] Iraq war, they are quite different. • (2) is a very rough indicator of the competence and discipline of U.S. forces; but • (1) is essentially an indicator of how unbalanced the conflict is. • After all, if an enemy is disarmed or surrenders before getting off a single shot, U.S deaths will be very low but, in any case, 100% of them necessarily result from friendly fire — there being no unfriendly fire to inflict any U.S. deaths.
Dangling Percentages: Row, Column, Total, or What? • The following slide, taken from a recent story in the Washington Post, show a number of pie charts pertaining to Ethiopian immigrants living in the Washington area. • What does 100% of each “pie” represent? • 10% is the answer to what question? • 19%? • 36%? • How should the pie chart(s) be set up to convey information in an intuitive way?