Download
1 / 24
240 likes | 306 Views
Leverage Points. Points of influence in HSC data for Principals. “Give me a lever long enough, and a point to rest it, and I can move the world.” - Archimedes. Definitions of Success. Marketing? Or – knowing how you are really going?

E N D
Leverage Points Points of influence in HSC data for Principals
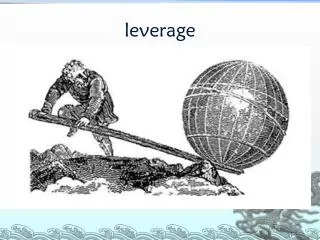
“Give me a lever long enough, and a point to rest it, and I can move the world.” - Archimedes
Definitions of Success • Marketing? • Or – knowing how you are really going? • The Flight Centre mistake: believing your own marketing, without checking – “Lowest Air Fares every time, GUARANTEED” • The idea of Comparative Learning Gain
What makes a difference in HSC results? Firstly, overall “TES”
What makes a difference… • Varies from subject to subject, as does the total variance accounted. • “school” is less visibly a difference the more teachers contribute to it; in a “large” measure like TES or SOR, the effect of the good teacher cancels out the poor; in more typically one-teacher subjects like Drama, it can be large. • You can tell which teacher is making a difference in “large” subjects: factor analysis (Leverage Pt# 11, later)
Confidentiality • Fragility of the data: handle with care • What to use for marketing, what not to use • How to “rig” a learning-gain system
Leverage Point #1: the Overall School Report • Graph #3 is the money graph: if you know nothing else in the analysis package, know what it’s doing • How to read The Overall School Report
Leverage Point #2: Participation • There’s a good deal of evidence to say that you get good results at the high end of subjects by promoting participation. • Creating a culture of challenge • Report 6 as the basis of investigating Participation • Compare yours to the whole-state Catholic participation
LP #3: The school pecking order • Numeric Report #4 • Be careful of making too much of the order • Why we don’t do league tables (of subjects or schools)
LP #4: Graph #4 on the Subject Trends… • If you find a subject that needs following up, check their Trend Graph #4: learning gain • A one-off, or a pattern • The “Columbo” question… “Can you just explain to me again why this graph looks like it does?” (… and for this one you can’t blame the students)
LP#9: Enter the names and engage the teachers • Most teachers aren’t engaged by stats • Frequent response to stats is defensive, dismissive, or false credit • Put in names, and get the anecdotes • Accentuate the positive, and work with what works. • Bulk entry of names: see the Manual
LP#5: A “Subject Report” Asking coordinators and teachers to report each year, using the “Coordinator’s Roadmap” against 4 questions: • What have you been doing, and why? • How is it going? • How do you know? • What are you going to do about it?
LP #6: Using the secondary analysis with sceptics • Is scepticism driven by data, or by a reluctance to change? • Looking at the Secondary Analysis, which doesn’t involve School Cert • Understanding the “Extension” effect in the secondary analysis
LP #7: Peer-to-Peer referrals • If any subject is consistently “below expectation” in learning gain, there is someone in another school getting an “above expectation”. • Setting the framework for the peer • Request: jsdec@zeta.org.au • Confidentiality; they phone you
LP#8: Subject selection • How does the process of subject selection and advice work in your school? • What’s the balance between student interest, estimated capability and challenge? • Do we need to challenge more? • Using the data: Numeric Report 1 • Do a scatterplot? – if you do, note the major factors in the subject
LP #10: The Second-order effects • First-order effects: “whole-of-group” – above expectation, in the range, or below expectation • Second-order effects: are you comparatively better with the higher or lower ability students? • No value judgments • The “see-saw” principle • Go back and look at Trend lines, and Numeric Report 4 • The idea is to look for patterns
LP #11: “Factor” analysis • Pulling apart a subject to see if an explanation holds water. • E.g., separating to different teachers; the claim that the smaller class the better the results; the need to do the subject in Year 10 in order to continue in Year 11. • See the Manual • Using the “Factor” button on the database • If you’re keen, re-plot the Achieved vs Expected
LP #12: Work the self-concepts • The strongest change-tool teachers have is student academic self-concept… • The strongest change-tool principals have is teacher professional self-concept • Creating a culture of challenge • Research of Marsh, Kugel, Rowe, Aronson – and DeCourcy • Coupling properly analyzed data with targetted professional development • The BFLPE • Data blindness or Data engagement
LP #13: Particular subject effects • History Extension: a 7% positive relationship for those who did take Modern History over those who didn’t • English Standard or Advanced: challenge to do Advanced • SOR and General Mathematics