Download
1 / 23
1.01k likes | 3.06k Views
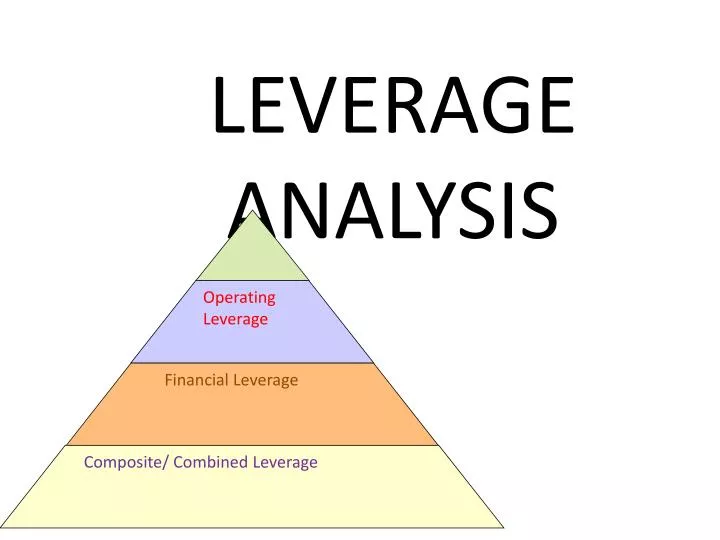
Operating Leverage. Financial Leverage. Composite/ Combined Leverage. LEVERAGE ANALYSIS. MEANING AND TYPE.

E N D
Operating Leverage Financial Leverage Composite/ Combined Leverage LEVERAGE ANALYSIS
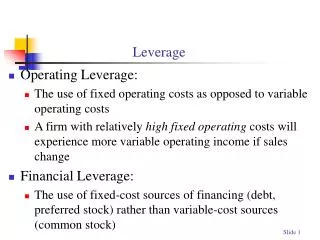
MEANING AND TYPE • The term ‘leverage’ refers to the ability of a firm in employing long term funds having a fixed cost, to enhance returns to the owners. In other words ‘leverage’ is the employment of fixed assets or funds which a firm has to meet fixed costs fixed rate of interest obligation irrespective of the level of activities attained or the level of operating profit earned. • The higher the leverage, higher the profits and the vice -versa. But a higher leverage obviously implies higher outside borrowings and hence riskier if the business activity of the firm suddenly takes a dip. But a low leverage does not having borrowed funds at a fixed cost to earn higher profits.
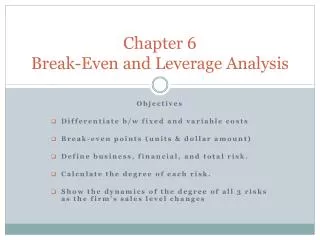
TYPES of leverages • Operating leverage • operating leverage is concerned with the operation of any firm. The cost structure of any firm gives rise to operating leverage because of the existence of fixed nature of costs. This leverage relates to the sales and profit variations. Sometimes a small fluctuation in sales, would have a great impact on profitability. This is because of the existence of fixed cost elements in the cost structure of a product.
Degree of operating leverage • The degree of operating leverage is depends upon the amount of fixed element in the cost structure. • Operating leverage can be determined by means of a break even or cost-volume-profit analysis. • operating leverage= contribution/ operating profit • OL = C/ EBIT (operating profit) • C = sales less variable cost ( S-V) • OP = C-Fc • B-E-P = Fc/ profit –volume ratio.(P/V ratio= S-V/S)
Points to be noted • When production and sales move above the break even point, the firm enters highly profitable range of activities. At break even point the fixed costs are fully recovered, any increase in sales beyond this level will increase profits equal to contribution. A firm operating with a high degree of leverage and above break even point earns good amount of profits. • If firm does not have fixed costs then there will be no operating leverage. The percentage change in sales will be equal to the percentage change in profit. When fixed costs are there, the percentage change in profits will be more than the percentage in sales volume. Thus , • DOL = % change in profits / % change in sales
Question 1 • Following is the cost information of a firm. • Fixed cost= Rs 50000. • Variable cost = 70 % of sales. • Sales = Rs 2,00,000 in previous year and Rs 2,50,000 in current year. • Find out % change in sales and operating profits, when: • (i) fixed costs are not there ( no leverage) • (ii) fixed costs are there (leveraged situation).
Risk factor • It is true that a high leveraged situation will magnify the operating profits but it brings in the risk element too. • The percentage change in profits will be more in a situation with higher fixed costs as compared to that where fixed costs are lower. • The higher degree of operating leverage brings in more decrease in operating profits. Let us understand with the help of the following illustration.
Question 2 • Installed capacity 1,000 units. • Operating capacity 800 units. • Selling price per unit Rs. 10 • Variable cost per unit Rs. 7 Calculate operating leverage under the following situations: (i) Situation A Fixed cost Rs 800. (ii) Situation B Fixed cost Rs 1,200. (iii) Situation CFixed cost Rs 1,500.
FINANCIAL LEVERAGE • The use of long term fixed interest bearing debt and preference share capital along with equity share capital is called financial leverage or trading on equity. • A firm is known to have a favourable leverage if its earnings are more than what debt would cost. On the contrary, if it does not earn as much as the debt costs then it will be known as an unfavourable leverage. • Financial leverage = EBIT/EBT • DOF = % Change in EPS/ % change in EBIT.
Question. • A firm is considering two financial plans with a view to examining their impact on Earnings per share(EPS). The total funds required for investment in assets are Rs 5,00,000. • Financial Plans • Plan I Plan II • 10% Debt 4,00,000 1,00,000 • Equity shares(Rs 10/-) 1,00,0004,00,000 • Total finances required 5,00,0005,00,000 • No of equity shares 10,000 40,000 • The EBIT are assumed as Rs 50,000, Rs 75,000, Rs 1,25,000. the rate of tax be taken at 50%. Comment.
Question. • Calculate EPS of Shy Ltd. and Smart Ltd. assuming (a) 20% before tax rate of return on assets (b) 10% before tax rate of return on assets based on the following data: • Shy Ltd. Smart Ltd. • (Rs in lakhs) (Rs in lakhs) • Assets 200 200 • Debt (12%) ---- 100 • Equity 200 100 • (share of Rs 10 each) • Assume a 50% income tax in both cases, give your comments on the financial leverage.
Degree of Financial Leverage. • The degree of financial leverage measures the impact of a change in operating income(EBIT) on change in earning on equity capital or on equity share. Degree of financial leverage DFL can be calculated as: • DFL= % change in EPS/ % change in EBIT or • DFL= EBIT/ EBT.
Question. • XYZ Company has currently an equity share capital of Rs 40 lakhs consisting of 40,000 equity shares of Rs 100 each. The management is planning to raise another Rs 30 lakhs to finance a major programme of expansion through one of the four possible financing plans. The options are: • (i) Entire through equity shares. • (ii) Rs 15 lakhs in equity shares of Rs 100 each and the balance in 8% Debentures. • (iii) Rs 10 lakhs in equity shares of Rs 100 each and the balance through long-term borrowing at 9% interest p.a. • (vi) Rs 15 lakhs in equity shares of Rs 100 each and the balance through preference shares with 5% dividend.
COMPOSITE/COMBINED LEVERAGE • Both financial and operating leverage magnify the revenue of the firm. Operating leverage affects the income which is the result of production. On the other hand, the financial leverage is the result of financial decisions. The composite leverage focuses attention on the entire income of the concern. The risk factor should be properly assessed by the management before using the composite leverage. The high financial leverage may be offset against low operating leverage or vice- versa. • DCL =% change in EPS/% change in sales. Or • CL = OL *FL
Question. • A company has sales of Rs 5,00,000, variable cost of Rs 3,00,000, fixed costs of Rs 1,00,000 and long-term loans of Rs 4,00,000 at 10% rate of interest. • Calculate , operating leverage, financial leverage and composite leverage.
IMPORTANT QUESTION • From the following information, prepare income statement of company A,B and C • A B C • Financial leverage 3: 1 4: 1 2:1 • Interest Rs 200 Rs 300 Rs 1000 • Operating leverage 4: 1 5: 1 3: 1 • Variable cost as a % of 66&2/3% 75% 50% sales. Income tax rate 45% 45% 45%
Case study LARSEN& TUOBRO(L&T) • L& T is a large multi-product company in the private sector. The company has gross sales of Rs 8078.46 crore and net profit of Rs 346.80 crore for the year ending 31st march 2002.the financial data is taken from the CMIE database for the year ending 31st march 2002. • financial data for 2002 (Rs in crore) • Net worth 2696.22 • Borrowings 1324.31 • Profit before interest and tax 1088.78 • Interest paid 92.09 • Fixed expenses (excluding interest) 1583.30
Measurement of financial leverage • Debt –equity ratio = 1324.31/2696.22 = 0.49 • Debt to total capital ratio = 1324.31 / (2696.22+1324.31)=0.33 • Interest coverage = 1088.78/92.09 =11.82 • For L & T the degrees of operating, financial and combined leverages are computed as follows: • DOL =PBIT + Fixed Cost)/ PBIT=(1088.78+1583.30)/1088.78 = 2.45 • DFL = PBIT/PBIT-INT=1088.78/(1088.78-92.09)= 1.09 • DCL = DOL*DFL = 2.45*1.09 =2.68
EBIT –ESP ANALYSIS • EBIT—EPS analysis is a method to study the effect of financial leverage under various levels of EBIT under alternative method of financing. • Question . • A firm has a capital structure exclusively comprising of ordinary shares amounting to Rs 1,00,000. the firm now wishes to raise additional Rs 1,00,000.for investment purposes . The company has 4 alternatives.
Conti- • It can raise the entire amount in the form of equity shares. • It can raise 50% as equity and 50% as 5% debentures. • It can raise entire amount by 5% debentures. • It can raise 50% equity and 50% as 5% pref.shares. • Further assume that existing EBIT is Rs 12,000, 8,000, 10,000,20,000 and 30,000. the tax rat is 50% ,outstanding no of equity shares are 1,000. • Which financing plan should the firm select? • The financial plan, which gives highest EPS, would be naturally better from the company’s point of view.
Analysis of results: • EPS increases along with the increase in EBIT under all financial plans. • When the financial leverage is absent (when only equity shares are issued),EPS increases proportionately along with the increase in EBIT, i,e. 1% change in EBIT will be followed by only 1% change in EPS as in the case of financial plan I. • If the ROI is less than the cost of debt (e.g: EBIT of Rs8,000 ROI=4%) there is unfavourable financial leverage. So EPS falls as and when more and more debt is issued.
Analysis of results cont- • If ROI is more than the cost of debt (e.g; EBIT of Rs30,000 ROI =15% ), there is favourable financial leverage. So issue of more and more of low cost debt increases the EPS. So EPS will be maximum when the debt is maximum. • If ROI is just equal to the cost of debt, issue of debt neither makes any sense nor objectionable. So there is neither favourable nor unfavourable financial leverage. So EPS remains same at an EBIT level of Rs 10,000(ROI=5%) under plans A,B and C.
Cont- • If the company considers the issue of 5% pref-shares , the ROI must be at least 10%. If the ROI is less than 10% of 5% pref-shares does not make sense. If the ROI is more than 10% issue of 5% pref-shares will increase the EPS. • Whenever the leverage is present the change in EPS for a given change in EBIT is more than proportionate. For example under the financial plan C, EPS is Rs 2.5 when EBIT is Rs 10,000 and it increases to Rs 7.5 on EBIT level of Rs 20,000. • The level of EBIT at which EPS is same under two or more alternatives is called indifference level of EBIT, for example, for alternatives A and B, indifference level of EBIT is Rs 10,000. for alternatives A and D indifference level of EBIT is Rs 20,0000. if the EBIT is below the indifference level, equity financing will give higher EPS and if the EBIT is above the indifference level debt or pref-shares capital will give higher EPS.