Download
1 / 16
160 likes | 165 Views
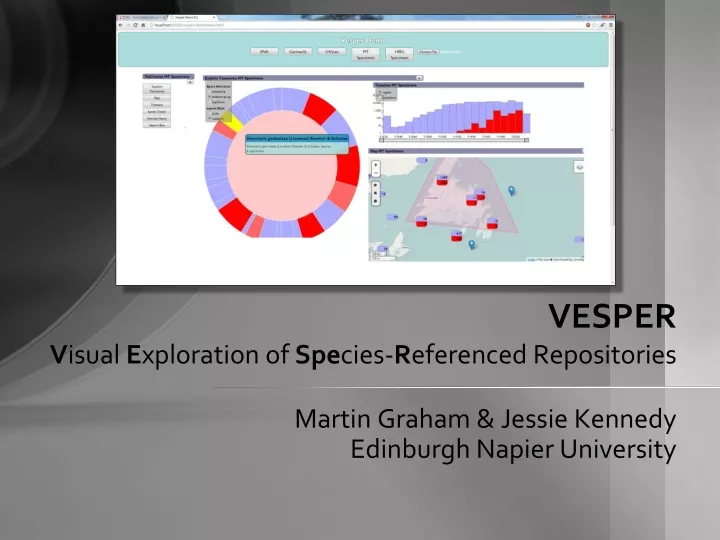
Explore data quality issues in Darwin Core Archives (DWCA) through web-based visualizations, leveraging HTML5, SVG, CSS3, and D3 toolkit.

E N D
VESPERVisual Exploration of Species-Referenced Repositories Martin Graham & Jessie Kennedy Edinburgh Napier University
Introduction • VESPER – an exploration into data quality issues for Darwin Core Archives (DWCA) • DWCA’s are files for storing detailed species-based data sets • How does a user know which data sets are useful and complete?
Valid vs. Useful • GBIF has tools to test DWCA validity • This work is about visualising data we assume is “valid” but are unsure of “usefulness” • Taxonomy is broken • Dates are wrong • Lions in the sea • In many cases the usefulness of such data is only seen when visualised in context
Approach • Web-based visualisation of DWCAs • Uses HTML5 • SVG, CSS3, FileWriters, ArrayBuffers • D3 toolkit • Client side only • Visualise basic dimensions of data • Taxonomy • Geography • Time • & Miscellaneous Stats
Darwin Core Archives Data Files (CSV) Exactly one Zero or more Meta Files (XML) Core Taxa/Occurrence Data Eml.xml Extension ID == Core ID Extension Describes Meta.xml Extension
Zapped by Zip • Zip files make things smaller • Good for network transport • But analysing the data means we have to make things big again Expand even more (String copying, UTF-16 etc) Expand a lot
Zip Zapped • Partial Unzip • Analyse fields listed in meta file • Disregard verbose fields • Find combinations of fields that can be used to generate a visualisation • List choice of available visualisations for a meta.xml and just extract chosen fields
Taxonomy • Sunburst / Icicle plot • Some difficulties with high fan-out taxa • Though a lot of these are data quality issues
Taxonomy • Sunburst / Icicle plot • Some difficulties with high fan-out taxa • Though a lot of these are data quality issues
Geography • Based on popular leaflet.js library • And Markercluster plugin • Some adaptations to show selected items
Temporal • Simple bar chart • With rangeslider • Zoom in and see yearly patterns (i.e not much at xmas)
Miscellaneous • Sanity check - Empty data count
Miscellaneous • Taxonomic fan-out for hollow curve anomalies • Export selected IDs • These can be saved or sent somewhere else
Selection • Selections in one view are reflected in the other views for the same data • Multiple views, linking
Conclusion • Javascript visualisations for DWCA archives • Quickly shows areas of quality issue • Can handle large archives if only key fields are analysed
Fin • http://www.soc.napier.ac.uk/~cs22/vesperDemo/vesper/demoNew.html • Feedback welcome • Thanks to GBIF, Canadensys, EMBL for data • Funded by BBSRC • Ask for a demo