Download
1 / 17
170 likes | 295 Views
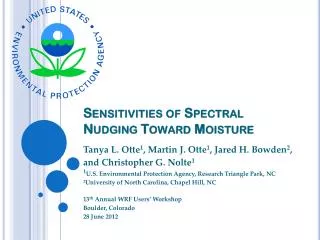
Sensitivities of Spectral Nudging Toward Moisture for Regional Climate Modeling. Tanya L. Otte 1 , Martin J. Otte 1 , Jared H. Bowden 2 , and Christopher G. Nolte 1 1 U.S. Environmental Protection Agency, Research Triangle Park, NC 2 University of North Carolina, Chapel Hill, NC

E N D
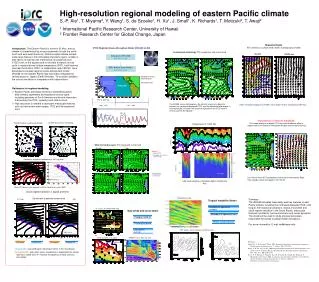
Sensitivities of Spectral Nudging Toward Moisturefor Regional Climate Modeling Tanya L. Otte1, Martin J. Otte1, Jared H. Bowden2, and Christopher G. Nolte1 1U.S. Environmental Protection Agency, Research Triangle Park, NC 2University of North Carolina, Chapel Hill, NC 11th Annual CMAS Conference Chapel Hill, North Carolina 17 October 2012
What is “nudging”? • Constraint toward a reference state • Retrospective runs: reference ~ comparable spatial resolution • Regional climate runs: reference ~ coarser spatial resolution • Nudging strategies depend on application! • Includes non-physical term that is: • Based on reference minus model • Scaled relative to inverse of e-folding time of phenomena (subjective) • Can be restricted in vertical (toward earth’s surface) • Grid nudging types: • Differences from gridded field at each grid point (“analysis”) • Wind, temperature, moisture* • Differences from gridded field from spectral wave decomposition • Wind, temperature, geopotential
Three 20-year Historical Runsin Regional Climate Mode • WRFv3.2.1: 2 Dec 1987 – 1 Jan 2008, continuous run • Initialized from 2.5° × 2.5° NCEP/DOE Reanalysis II • 108-36-km, 2-way-nested • 34 layers, top at 50 hPa • WSM6 microphysics • Grell ensemble convection • RRTMG radiation • YSU PBL scheme • NOAH LSM • Nudging: none (NN), analysis (AN), spectral (SN) • No nudging in PBL; some changes to coefficients • Comparisons to NARR and CFSR on 36-km domain Figure courtesy J. Herwehe
Precipitation Difference from NARR (averaged over 20-year period) 60 40 20 0 -20 Compare to 3-h, 32-km NARR 60 40 mm 20 0 -20 Otte et al., J. Climate, 2012 SN is consistently wetter than AN in 5 of 6 regions. SN wet bias is often as large as or larger than NN.
Effects of Nudging on Precipitation Extremes Annual Area-Average Days Exceeding Threshold Precipitation Midwest 40 Days >0.5” 30 Compare to 3-h, 32-km NARR 20 Days >1.0” 10 0 88 89 90 91 92 93 94 95 96 97 98 99 00 01 02 03 04 05 06 07 Otte et al., J. Climate, 2012 AN closer to NARR than SN for extremes of precipitation.
We Prefer to use Spectral Nudging for Regional Climate Modeling • SN is spatial-scale-selective whereas AN is not. • SN preserves spatial variability in the desirable range. • AN produces comparable 2-m temperature to and better precipitation than SN, but dampens variability. • Motivating Science Question: Can SN precipitation be improved without compromising 2-m temperature? • Hypothesis: SN will predict precipitation better if also nudging toward moisture.
Taylor Diagrams – Precipitable Water (“SN Sensitivities with Nudging Q” vs. NARR, 3-yr) Northwest Midwest Northeast Southwest Plains Southeast Adding SN toward moisture (all except ▪)improves PWAT comparison to NARR, even in PBL, and not always in same direction (SW vs. NW).
We iterated on strategies to use spectral nudging of moisture. • “Default” coefficient (~1 h timescale) is too strong • Did not improve precipitation • Resulted in too many clouds • Conservative coefficient (~6 h timescale) works well • Tracks consistently with AN (same coefficient) • Both had too many high clouds and too low OLR! • Implemented “reverse Zfac” to limit nudging above tropopause • Restricted nudging of above tropopause and lowered its coefficient to match Q • G = 4.5 × 10⁻⁵ s-1andGQ = 4.5 × 10⁻⁵ s-1 (time scale ~6 h) • Same coefficients used on both domains
20-Year Monthly Precipitation Difference from NARR Northwest SN_with_Q reduces overprediction of monthly precipitation in SN. Midwest 50 50 mm 0 0 -50 -50
Annual Area-Average Days with Precipitation >0.5” Northwest SN_with_Q improves prediction of extreme precipitation events. Midwest 40 40 20 20 days 0 0
20-Year Monthly Temperature Difference from CFSR Northwest Overall, SN_with_Q improves 2-m temperatures compared with SN. Midwest 2 2 K 0 0 -2 -2
Annual Area-Average Days with Temperature >90°F Northwest SN_with_Q creates slight to modest improvements in prediction of extreme warm temperatures. Midwest 60 60 40 40 days 20 20 0 0
Comparison to CERES:LW Upward Radiation at TOA Northwest Midwest 300 300 250 250 W m-2 200 200 150 150 Both agree well with CERES outgoing longwave radiation.
Comparison to CERES:SW Upward Radiation at TOA Northwest Midwest 200 200 150 150 W m-2 100 100 50 50 Both agree well with CERES outgoing shortwave radiation,although SN slightly better in Midwest.
Comparison to CERES:Cloud Fraction (above 300 hPa) Northwest Midwest 1.0 1.0 0.8 0.8 0.6 0.6 fraction 0.4 0.4 0.2 0.2 0.0 0.0 SN_with_Q reduces overprediction of very high clouds by 0.05.
Comparison to CERES:Cloud Fraction (300-500 hPa) Northwest Midwest 1.0 1.0 0.8 0.8 0.6 0.6 fraction 0.4 0.4 0.2 0.2 0.0 0.0 SN_with_Q slightly reduces high cloud fraction throughout year compared to SN.
Spectrally nudging moisture can improve precipitation in WRF! • Did not compromise 2-m temperature verification! • Improved extreme heat predictions! • Must be careful and conservative! • Default coefficient (GQ = 3.0 × 10⁻⁴ s-1) is too high! • Fairly low coefficient (GQ = 1.0 × 10⁻⁵ s-1) is too low! • Can be limited to below tropopause • High clouds and radiation more consistent with CERES • Little effect on 2-m temperature or precipitation • Also restricting nudging above tropopause and reducing G improves simulation • Applying consistent nudging to thermodynamics