Download
1 / 32
320 likes | 343 Views
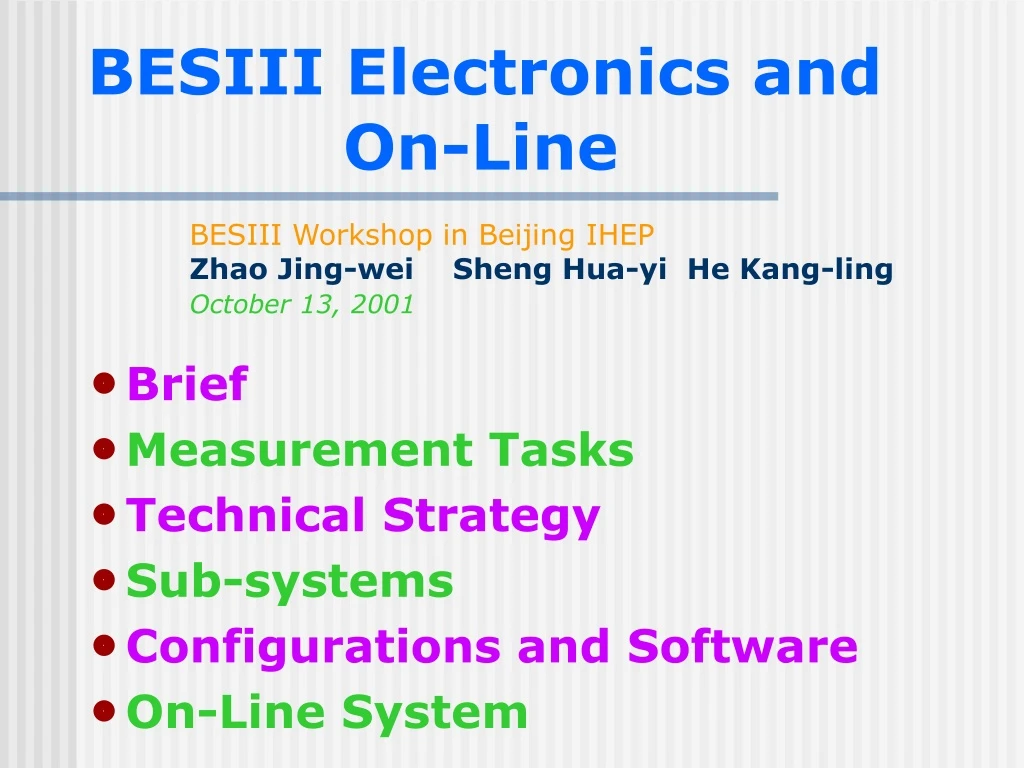
BESIII Electronics and On-Line BESIII Workshop in Beijing IHEP Zhao Jing-wei Sheng Hua-yi He Kang-ling October 13, 2001. Brief Measurement Tasks Technical Strategy Sub-systems Configurations and Software On-Line System. Brief. BESIII ’ s sub-detectors are:

E N D
BESIII Electronics and On-Line BESIII Workshop in Beijing IHEPZhao Jing-wei Sheng Hua-yi He Kang-lingOctober 13, 2001 • Brief • Measurement Tasks • Technical Strategy • Sub-systems • Configurations and Software • On-Line System
Brief BESIII’s sub-detectors are: • Vertex Chamber • Main Drift Chamber • TOF plus CCT Counter • Electromagnetic Calorimeter • MUON Identifier Electronics will consist of five sub-systems correspondingly. Total channel amount is about 50K~77K.
Measurement Tasks • To measure the time information carried by detector signal. • To measure the charge values carried by detector output signals or signal amplitude. • To deliver the information of fired point position (x,y) in detector cells. • To provide the hit information or sum of analog signals for making trigger decision. • To implement data taking and data formatting and preprocessing and sub-event packing. • To transfer the packed data to On-line computer system via fast switch network.
Technical Strategy • Short bunch crossing (8 ns) Long trigger latency (2.4us) pipeline must be used. • High luminosity (1×1033cm-2s-1). High event rate. Parallel processing on-board is needed to make dead time as small as possible.
Technical Strategy • High beam intensity (1100 mA×2) Short lifetime (3-4 hours) Bad noise environment Measures must be taken to make system immune from noise background and RF interference. • Weak signal, especially for VC, EMC and MDC. low noise technique must be adopted.
Sub-systemMDC Tasks Tasks & technical requirements • The charge deposition on sense wire (dE/dx) Charge range : 8~1500 fc Resolution : σQ ≈ 4 fc • The drift time of ionized electrons towards sense wires. (to determine the spatial trajectory of particles and the momentum of particles.) Time range : 0~500ns Resolution :σt ≈ 0.5ns • Hit information to trigger
Sub-system MDC Scheme 1 Based on “Q to T converter + HPTDC” Preamp Wire signal Q to T based mainamp CERN HPTDC based TDC VMEbus trigger Calibration Online
Sub-system MDC Scheme 1 • Preamp. A transimpedance type Low noise Low power dissipation • Main amp. Based on Q to T converter –MQT300A • TDC module Adopt CERN HPTDC as a key component. • Advantage for above scheme: Simple system: Use only TDC to measure both the time and charge.
Sub-system MDC Scheme 2 Based on “FADC and HPTDC” Trigger Q measurement Preamp dE/dX Wire Signal Mainamp Timing T measurement Vth Start Trigger VMEbus Clock Calibration online
Sub-system MDC Scheme 2 • Charge measurement is based on FADC waveform sampling& Numerical integral. 10bit and 40MHz FADC is required. 9U VME board and 32 ch./board • Time measurement is based on CERN HPTDC chip 9U VME board and 96 or 128 ch./board
Sub-system VC • Charge information Range = 0.22 fc on average σQ ≤20% at 0.22fc Ch. = 300 • Hit information to trigger
Sub-system EmC Tasks Charge measurement Range : 0.2 fc to 300 fc Resolution : q= 0.1 fc
B G O Sub-system EmC Block diagram Preamplifier Post amplifier ∑ Charge measurement controller (RC2) CR Σ V M E Trigger ∑ Fan - out Trigger L1 CTrigger CL1 Trigger L1 calibration
Sub-system EmC Brief introduction • 20200 BGO crystals • Charge-sensitive preamplifier to receive the signal from photodiode • 20MHz FADC to digitize the waveform • 15 bit dynamic range is needed. • 10 bit resolution is required.
Sub-system EmC Scheme • Preamplifiers are mounted on the BGO crystals. • Two signals from each crystal are added together, and then feeds to post-amplifier for further amplifying and shaping. • FADC samples the signal with 20MHz. The data are pushed to the digital pipeline. The length of the pipeline equals the trigger L1 latency. • Digitized data within 1.5ms interval are read out by a peak finding circuit on arrival of trigger L1. The peak value is stored in a buffer for readout by VME. • Auto Range Encode Circuits are employed to expand the FADC dynamic range from 10 bits to 15 bits.
Sub-system TOF Tasks • To provide the information for particle identification by measuring the flight time of the particles. • To correct the flight time by measuring the charge . • To provide hit information to trigger
Sub-system TOF Requirement • Time measurement Number of channels: 320 Range : 0~60ns Resolution : σt ≤25ps • Charge measurement Number of channels : 320 Dynamic range : 2Vmax for TOF 0.2Vmax for CCT Resolution :2% at 2V for TOF 2% at 0.2V for CCT
Trigger L1 Splitter Pre-amp Signal Driver Q Read-out 10ns L-threshold LL delay Stop L0 trigger Read-out T Start H-threshold HL To Trigger From Online Calibration Sub-system TOF Block Diagram
Peak-finding V/I VME BUS FIFO FADC FIFO R W W 40MHz CLK Trigger L1 Sub-system TOFCharge measurement The circuitry consists of the Voltage-to-Current converter,integrator, FADC and two FIFOs.
vcc Delay + FADC STOP TAC START S !Q R Q _ Temp control L0 200ns CLK 40M Sub-system TOF Time measurement TOF time measurement schema is based on TAC plus FADC.
Sub-system MuonTasks Tasks & technical requirements • To deliver the information of fired point position(x,y) in detector cells. • The hit informationto trigger
Sub-system Muon Configuration • Configuration • Modules of VME 7 • Chains in a module 24 • Data of a chain 256 • Total data of readout system 10K~30K
Configuration and SoftwareTasks • DAQ L1 Event Rate ≈ 3000Hz • Event Length ≈ 6K~10K Byte • Read Out Tasks: protocols & communications system control data taking Preprocessing transmission 50K~77K channels will be read out and preprocessed and sent out reduce the “dead-time” in data taking from read out electronics avoid “bottle-neck” of data flow
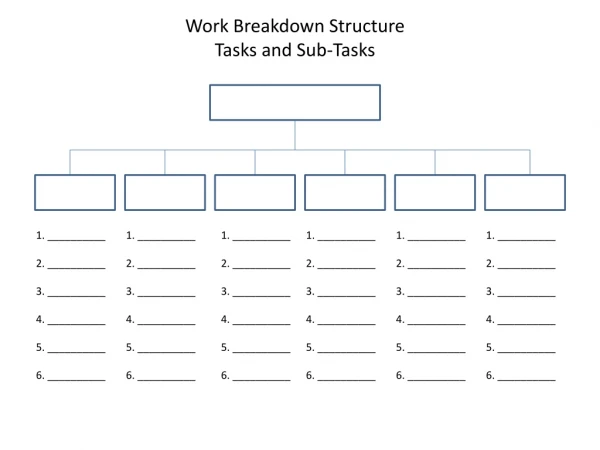
Configuration and SoftwareStructure branch 1 branch n
Configuration and SoftwareDevice • Read-Out Crate VME Crate + ADC/TDC modules + Processor There are ~600 channels in each read out crate. ~90 VME crates will be needed. • Branch Computer(Multi-CPU) + Switch(100M) + Crates Multi-Port network card will be used to the computer. One port is linked to the online computer system via a Gigabit switch, others are linked with the processors of Read-Out Crates via 100M switch. There are 1~6 VMERead Out Crates per branch. There are >16 branches in BESIII read out electronics system.
Configuration and SoftwareDesign Consideration • Adopt Commercial Product PowerPC 、100M Switch、Computer and others • Consider to adopt new technique and future device Performance/cost ratio • The software developing environment VxWorks and x86 BSP、PowerPC750 BSP
On-Line System Tasks • Event rate ~2000Hz after L2 filter • ~16MBytes/sec to persistent store • Event Builder System Transport information from readout crate to Online(L2) farm • L2 trigger System Software trigger. Selects events for storage • Online System • Run environment monitoring and controlling • Experiment monitoring and controlling • Human interface
On-Line System Tasks • Data Storage mass storage and transmission via fast network • Slow control system • HV control and monitoring • Environmental monitoring • Dead time & Luminosity monitoring • Tests
On-Line System Requirements • High performance computer • Graphics User Interface to experiment • Functional requirement • Configuration and constants of system • Execute command to FEE and Farm nodes • Error message reports for FEE and Farm nodes • Calibration Support • Diagnostic Tools • Data Monitoring Support • Database and network support