Download
1 / 97
970 likes | 1.05k Views
2009 - FNSB Economy: Model Overviews. How to use this presentation: Click on boxes to navigate to desired category Use “ Home ” Button to return to this menu page Use “ Exit ” Button to close the slide show

E N D
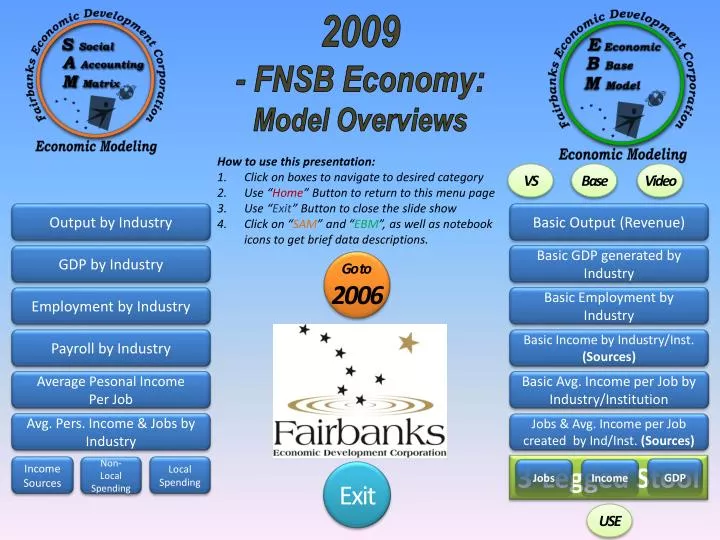
2009 - FNSB Economy: Model Overviews How to use this presentation: Click on boxes to navigate to desired category Use “Home” Button to return to this menu page Use “Exit” Button to close the slide show Click on “SAM” and “EBM”, as well as notebook icons to get brief data descriptions. VS Base Video Output by Industry Basic Output (Revenue) GDP by Industry Basic GDP generated by Industry Go to 2006 Employment by Industry Basic Employment by Industry Payroll by Industry Basic Income by Industry/Inst. (Sources) Average Pesonal Income Per Job Basic Avg. Income per Job by Industry/Institution Avg. Pers. Income & Jobsby Industry Jobs & Avg. Income per Job created by Ind/Inst. (Sources) 3-Legged Stool Income Sources Non-Local Spending Local Spending GDP Jobs Income Exit USE
2009 - FNSB Economy: Model Overviews Social Accounting Matrix (SAM) Model: Unlike many other studies, using Input-Output (IO) models, we constructed a Social Accounting Matrix (SAM) model to determine the roles of industries in the FNSB. The SAM allows us to incorporate transactions that are unique to Alaska and Fairbanks, such as: (1) government, military, and PFD transfer payments to residents, (2) leakages of labor, and property type incomes, (3) payments and impacts on different levels of households. Close Info Box How to use this presentation: Click on boxes to navigate to desired category Use “Home” Button to return to this menu page Use “Exit” Button to close the slide show Click on “SAM” and “EBM”, as well as notebook icons to get brief data descriptions. VS Base Video Output by Industry Basic Output (Revenue) GDP by Industry Basic GDP generated by Industry 2006 Employment by Industry Basic Employment by Industry Payroll by Industry Basic Income by Industry/Inst. (Sources) Average Pesonal Income Per Job Basic Avg. Income per Job by Industry/Institution Avg. Pers. Income & Jobsby Industry Jobs & Avg. Income per Job created by Ind/Inst. (Sources) 3-Legged Stool Income Sources Non-Local Spending Local Spending GDP Jobs Income Exit USE
2009 - FNSB Economy: Model Overviews Economic Base Model: The economic base model was developed to determine the drivers of our economy. Economic base theory states that the economic base (export base) determines a region’s total level of economic activity (Seung, Waters et al. 2002). The development of a base model requires the definition of endogenous (internal) and exogenous (external) industries, and their demands on the FNSB economy. Parts of government spending (Defense), tourism, investments and exports are exogenous money flows and are used to construct an impact (exogenous shock) matrix of the regional economy. The resulting multipliers reflect features considered in our SAM such as: property type income, intermediate outlay leakages, the permanent fund dividend, military, and government or household transfer payments unique to Alaska and the FNSB. Close Info Box How to use this presentation: Click on boxes to navigate to desired category Use “Home” Button to return to this menu page Use “Exit” Button to close the slide show Click on “SAM” and “EBM”, as well as notebook icons to get brief data descriptions. VS Base Video Output by Industry Basic Output (Revenue) GDP by Industry Basic GDP generated by Industry 2006 Employment by Industry Basic Employment by Industry Payroll by Industry Basic Income by Industry/Inst. (Sources) Average Pesonal Income Per Job Basic Avg. Income per Job by Industry/Institution Avg. Pers. Income & Jobsby Industry Jobs & Avg. Income per Job created by Ind/Inst. (Sources) 3-Legged Stool Income Sources Non-Local Spending Local Spending GDP Jobs Income Exit USE
Go to 2006 Exit Home Source: FEDC, Social Accounting Matrix, 2009;
Exit Home Go to 2006
Exit Home Go to 2006
Exit Home Go to 2006
Go to 2006 Exit Home
Go to 2006 Exit Home Source: FEDC, Social Accounting Matrix, 2009;
Go to 2006 Exit Home $ Millions
Go to 2006 Exit Home
Go to 2006 Exit Home Source: FEDC, Social Accounting Matrix, 2009;
Go to 2006 Exit Home
Go to 2006 Exit Home Source: FEDC, Social Accounting Matrix, 2009.
Go to 2006 Exit Home
Go to 2006 Employment vs. Wages Exit Home Source: FEDC, Social Accounting Matrix, 2009;**Full and part time jobs
Go to 2006 Exit Home
Go to 2006 Exit Home
Go to 2006 Exit Home Source: FEDC, Social Accounting Matrix, 2009;
Go to 2006 Exit Home
Go to 2006 Exit Home Source: FEDC, Social Accounting Matrix, 2009;*Full and part time jobs
Go to 2006 Exit Home
Go to 2006 E.G. Military: 39% of all jobs in the FNSB economy are derived (directly, indirectly, and induced) from external money flows ($ from outside FNSB) the Military brings in to the FNSB economy. In other words, if hypothetically Military operations were discontinued, a total of 39% of all jobs in our economy would be lost. Exit Home
Go to 2006 Exit Home Source: FEDC, Social Accounting Matrix, 2009;
Go to 2006 Exit Home
Go to 2006 Exit Home
Go to 2006 Exit Home Source: FEDC, Economic Base Model 2009;
Go to 2006 Exit Home
Go to 2006 Exit Home Source: FEDC, Economic Base Model 2009;
Go to 2006 Exit Home
Go to 2006 Exit Home
Go to 2006 E.G.: Military: 46% of all income (sales, government transfer payments, and other) in the FNSB economy is derived (directly, indirectly, and induced) from external money flows ($ from outside FNSB) the Military brings in to our economy. In other words, if hypothetically, Military operations were discontinued, a total of 46% of all income to our economy (industries, households, and local government in forms of sales, contracts, transfer payments, wages, taxes, grants, etc.) would be lost. Exit Home
Go to 2006 Exit Home Source: FEDC, Economic Base Model 2009;
Go to 2006 Exit Home
Go to 2006 Exit Home Source: FEDC, Economic Base Model 2009;
Go to 2006 Exit Home
Go to 2006 Exit Home Source: FEDC, Economic Base Model 2009;
Go to 2006 Exit Home
Go to 2006 Exit Home Source: FEDC, Economic Base Model 2009;
Go to 2006 Exit Home $ Millions
2006 FNSB Economy: Model Overviews How to use this presentation: Click on boxes to navigate to desired category Use “Home” Button to return to this menu page Use “Exit” Button to close the slide show Click on “SAM” and “EBM”, as well as notebook icons to get brief data descriptions. Output by Industry Basic Output (Revenue) GDP by Industry Basic GDP generated by Industry Go to 2009 Employment by Industry Basic Employment by Industry Payroll by Industry Basic Income by Industry/Inst. (Sources) Average Income Per Job Basic Avg. Income per Job by Industry/Institution Industries’ Income Sources Jobs & Avg. Income per Job by Industry/Institution (Sources) Local Spending by Industry Non-Local Spending 3-Legged Stool Jobs Income GDP Exit
2006 FNSB Economy: Model Overviews Social Accounting Matrix (SAM) Model: Unlike many other studies, using Input-Output (IO) models, we constructed a Social Accounting Matrix (SAM) model to determine the roles of industries in the FNSB. The SAM allows us to incorporate transactions that are unique to Alaska and Fairbanks, such as: (1) government, military, and PFD transfer payments to residents, (2) leakages of labor, and property type incomes, (3) payments and impacts on different levels of households. Close Info Box How to use this presentation: Click on boxes to navigate to desired category Use “Home” Button to return to this menu page Use “Exit” Button to close the slide show Click on “SAM” and “EBM”, as well as notebook icons to get brief data descriptions. Output by Industry Basic Output (Revenue) GDP by Industry Basic GDP generated by Industry Go to 2009 Employment by Industry Basic Employment by Industry Payroll by Industry Basic Income by Industry/Inst. (Sources) Average Income Per Job Basic Avg. Income per Job by Industry/Institution Industries’ Income Sources Jobs & Avg. Income per Job by Industry/Institution (Sources) Local Spending by Industry Non-Local Spending 3-Legged Stool Jobs Income GDP Exit
2006 FNSB Economy: Model Overviews Economic Base Model: The economic base model was developed to determine the drivers of our economy. Economic base theory states that the economic base (export base) determines a region’s total level of economic activity (Seung, Waters et al. 2002). The development of a base model requires the definition of endogenous (internal) and exogenous (external) industries, and their demands on the FNSB economy. Parts of government spending (Defense), tourism, investments and exports are exogenous money flows and are used to construct an impact (exogenous shock) matrix of the regional economy. The resulting multipliers reflect features considered in our SAM such as: property type income, intermediate outlay leakages, the permanent fund dividend, military, and government or household transfer payments unique to Alaska and the FNSB. Close Info Box How to use this presentation: Click on boxes to navigate to desired category Use “Home” Button to return to this menu page Use “Exit” Button to close the slide show Click on “SAM” and “EBM”, as well as notebook icons to get brief data descriptions. Output by Industry Basic Output (Revenue) GDP by Industry Basic GDP generated by Industry Employment by Industry Basic Employment by Industry Payroll by Industry Basic Income by Industry/Inst. (Sources) Average Income Per Job Basic Avg. Income per Job by Industry/Institution Industries’ Income Sources Jobs & Avg. Income per Job by Industry/Institution (Sources) Local Spending by Industry Non-Local Spending 3-Legged Stool Jobs Income GDP Exit
Go to 2009 Model Exit Home
Exit Home Go to 2009 Model
Exit Home Go to 2009 Model
Exit Home Go to 2009 Model
Go to 2009 Model Exit Home
Go to 2009 Model Exit Home Source: FEDC, Social Accounting Matrix 2006
Go to 2009 Model Exit Home $ Millions