Download
1 / 25
250 likes | 258 Views
Olympic College - Topic 7 Graphing a Linear Equation Topic 7 Graphing a Linear Equation 1. The Linear Equation Definition: A linear equation is one of the form y = mx + b, for example y = 2x – 5, where x represents the x coordinate and y the y coordinate. The set of all points which

E N D
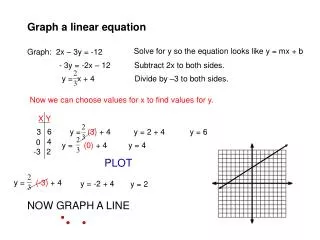
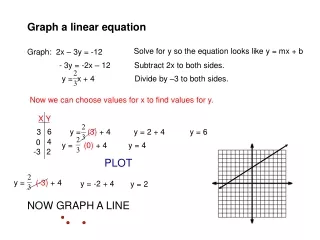
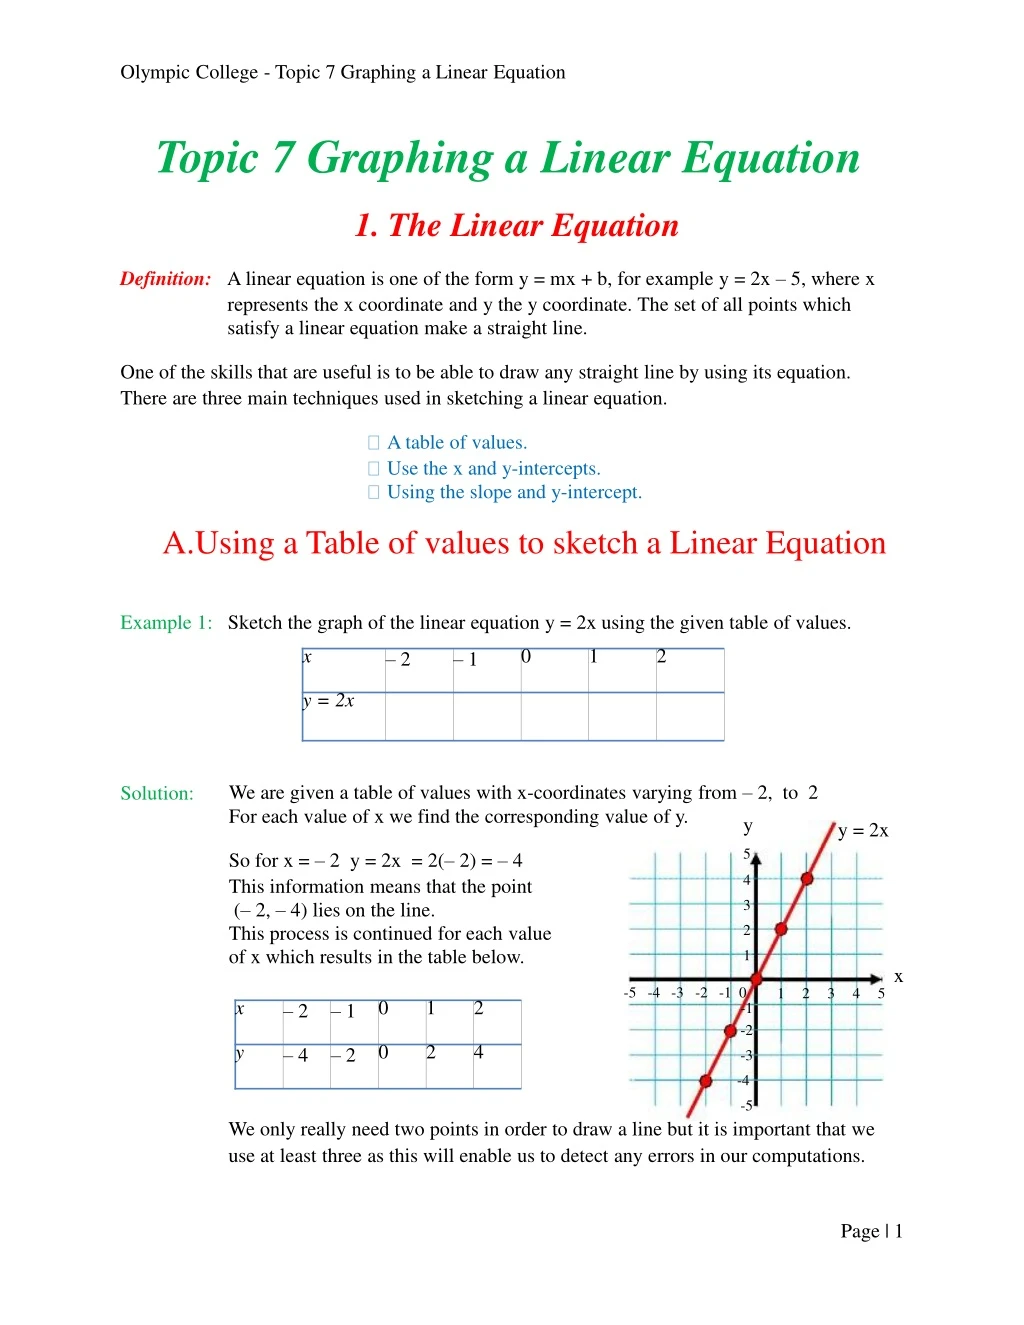
Olympic College - Topic 7 Graphing a Linear Equation Topic 7 Graphing a Linear Equation 1. The Linear Equation Definition: A linear equation is one of the form y = mx + b, for example y = 2x – 5, where x represents the x coordinate and y the y coordinate. The set of all points which satisfy a linear equation make a straight line. One of the skills that are useful is to be able to draw any straight line by using its equation. There are three main techniques used in sketching a linear equation. A table of values. Use the x and y-intercepts. Using the slope and y-intercept. A.Using a Table of values to sketch a Linear Equation Example 1: Sketch the graph of the linear equation y = 2x using the given table of values. We are given a table of values with x-coordinates varying from – 2, to 2 Solution: For each value of x we find the corresponding value of y. So for x = – 2 y = 2x = 2(– 2) = – 4 This information means that the point (– 2, – 4) lies on the line. This process is continued for each value of x which results in the table below. y 5 4 3 2 1 y = 2x x -5 -4 -3 -2 -1 0 1 2 3 4 5 -1 -2 -3 -4 -5 We only really need two points in order to draw a line but it is important that we use at least three as this will enable us to detect any errors in our computations. Page | 1
Olympic College - Topic 7 Graphing a Linear Equation Example 2: Sketch the graph of the linear equation y = 3x – 2 using the given table of values. We are given a table of values with x-coordinates varying from – 1, to 2 For each value of x we find the corresponding value of y. Solution: y = 3x – 2 y 5 4 3 2 1 So for x = – 1 y = 3x – 2 = 3(– 1) – 2 = – 5 This information means that the point (– 1, – 5) lies on the line. This process is continued for each value of x which results in the table below. x -5 -4 -3 -2 -1 0 -1 1 2 3 4 5 -2 -3 -4 -5 Example 3: Sketch the graph of the linear equation y = x y= using a table of values. Solution: We are not given the values of x to use in this situation. We can choose to use any x-values we like but it makes sense to choose values that give whole numbers for the corresponding y – values. So we use x = – 4, – 2, 0 and 2. y 5 So for x = – 4 y = = y = 3x – 2 x 4 5 4 3 2 1 -5 -4 -3 -2 -1 0 This information means that the point (– 4, – 1) lies on the line. This process is continued for each value of x which results in the table below. 1 2 3 -1 -2 -3 – 4 – 1 – 2 0 x 0 1 2 2 y= -4 -5 Page | 2
Olympic College - Topic 7 Graphing a Linear Equation Example 3: Sketch the graph of the linear equation 2x + 3y = 6 using a table of values. Solution version 1: We are not given the values of x to use in this situation so we can choose to use any x-values we like but it makes sense to choose values that give whole numbers for the corresponding y – values. In these circumstances we use x = – 3, 0, 3, 6 and 9 as these are all multiples of 3 and they will work well with the 3y and the 6 that are also multiples of 3. So for x = 6 2x + 3y = 6 2(6) + 3y 12 + 3y 3y y = = = = = 6 6 – 6 – 2 Replace the x with 6 Subtract 12 from both sides Divide both sides by 3 This information means that the point (6, – 2) lies on the line. This process is continued for each value of x which results in the table below. These points are now plotted on the Cartesian grid below to give the graph of the linear equation. y 5 4 3 2 1 x 9 -5 -4 -3 -2 -1 0 7 8 5 6 1 2 3 4 -1 -2 -3 -4 2x+3y = 6 -5 Page | 3
Olympic College - Topic 7 Graphing a Linear Equation Example 3: Sketch the graph of the linear equation 2x + 3y = 6 using a table of values. Solution version 2: In this question the equation of the line is given in its standard form 2x + 3y = 6 we can transform this into its equivalent slope intercept form by using algebra. 2x + 3y = 6 – 2x + 6 3y = = Subtract 2x from both sides divide both sides by 3 y We can now sketch y = = in the usual way. We are not given the values of x to use in this situation so we can choose to use any x-values we like but it makes sense to choose values that give whole numbers for the corresponding y – values. In this situation we use x = – 3, 0, 3, 6 and 9 as these are all multiples of 3 and they will work well with the . So for x = 6 y= = This information means that the point (6, – 2) lies on the line. This process is continued for each value of x which results in the table below. These points are now plotted on the Cartesian grid below to give the graph of the linear equation. y 5 4 3 2 1 x 9 -5 -4 -3 -2 -1 0 7 8 5 6 1 2 3 4 -1 -2 -3 -4 -5 2x+3y = 6 Page | 4
Olympic College - Topic 7 Graphing a Linear Equation Exercise 1A: 1. 2. 3. 4. 5. Draw the line has with the equation y = Draw the line has with the equation y = Draw the line has with the equation y = Draw the line has with the equation y = Draw the line has with the equation y = using the table of values below. using the table of values below. using the table of values below. using the table of values below. using the table of values below. Draw the line has with the equation 2x – 3y = 12 using the table of values below. Draw the line has with the equation 4x + 2y = 8 using the table of values below. 6. 7. Page | 5
Olympic College - Topic 7 Graphing a Linear Equation B. Using x and y-intercepts to sketch a Linear Equation. y The x-intercept of a line is the point where it cuts the x-axis, it can be found by putting y = 0 into the equation of a line and solving for x. y-intercept x In a similar fashion the y-intercept of a line is the point where it cuts the y-axis and can be found by putting x = 0 into the equation of a line and solving for y. x-intercept Example 1: Sketch the graph of the linear equation y = 4x + 12 by finding its x and y-intercepts Solution: We find the y-intercept by putting x = 0 and finding the corresponding y-value. y = 4x + 12 = 4(0) + 12 = 12 The y-intercept is the point (0,12) We find the x-intercept by putting y = 0 and finding the corresponding x-value. y 0 = = 4x + 12 4x + 12 – 12 – 3 = = = 4x x subtract 12 from both sides divide both sides 4 The x-intercept is the point (– 3,0) We now plot the x and y –intercepts and by joining these points we have the required line. y 12 10 8 x 6 4 2 – 3 – 2 – 1 – 4 Page | 6
Olympic College - Topic 7 Graphing a Linear Equation Example 2: Sketch the graph of the linear equation 2x + 3y = 6 by finding its x and y-intercepts. Solution: We find the y-intercept by putting x = 0 and finding the corresponding y-value. We find the x-intercept by putting y=0 and finding the corresponding x-value. 2x + 3y 2(0) + 3y 3y y = = = = 6 6 6 2 2x + 3y 2x + 3(0) 2x x = = = = 6 6 6 3 The y-intercept is the point (0,2) The x-intercept is the point (3,0) We now plot the x and y –intercepts and by joining these points we have the required line. y x 2x + 3y = 6 Note: When you use the x and y intercepts to draw a line you no longer have the advantage of being able to easily detect errors in your calculations that would appear if you plot 3 or more points so you must be extra careful when you use this method. This method also does not always yield easy to use points as complex fractions can arise. For example, 2x + 7y = 5 will give an x –intercept of and a y–intercept of These points do not lend themselves to plotting accurate positions and so the resulting line can be inaccurate as a result. Page | 7
Olympic College - Topic 7 Graphing a Linear Equation Exercise 1B: Draw each of the following lines by first finding their x and y-intercepts. y = 2x – 7 y = 7x + 21 1. 2. 3. 4. 5. y= y= y= +6 +9 – 9 6. 7. 8. 9. 2x + 4y = 8 10x + 5y = – 5 2x – 4y = 12 18x + 3y = 9 4x – 10. = Page | 8
Olympic College - Topic 7 Graphing a Linear Equation C. Using slope and y-intercepts to sketch a Linear Equation. The slope of a line can be found by using the formula. Slope = in a geometric way the slope of a line can be seen as starting at one point and moving it up or down in the Rise movement first and then moving it to the right in the Run movement. y Run Finishing point Rise x Starting point We then join the starting point to the finishing point. To draw the line with the required slope. In order to draw a line using the slope and y-intercept we use the y-intercept as the starting point and then from this position we use the slope to create the line. Example 1: Sketch the line y = 3x – 2 using its slope and y-intercept. Solution: This line has a slope of m = 3 and a y-intercept of (0,– 2). Since the slope is 3 then y Finishing point Slope = Run this means that the Rise = 3 and the Run = 1. We use the y-intercept of (0,– 2) as the starting point and then x Rise Starting point move up 3 (the Rise) and then move to the right 1 place (Run) to the right to reach the finishing point at (1,1). We then joint these two points and continue the line to sketch the line y = 3x – 2 Page | 9
Olympic College - Topic 7 Graphing a Linear Equation Example 2: Sketch the line y = – 4x + 3 using its slope and y-intercept. This line has a slope of m = – 4 and a y-intercept of (0,3). Since the slope is – 4 then Solution: y Starting point Slope = Rise this means that the Rise = –4 and the Run = 1. We use the y-intercept of (0,3) as the starting point and then x Finishing point Run move down 4 places (the Rise) and then move to the right 1 place (Run) to the right to reach the finishing point at (1, – 1). We then joint these two points and continue the line to sketch the line y = – 4x + 3 Example 3: Sketch the line y = using its slope and y-intercept. Solution: This line has a slope of m = and a y-intercept of (0,– 4). Since the slope is 3 then Slope = this means that the Rise = 3 and Run = 4. y x Run Finishing point We use the y-intercept of (0,– 4) as the starting point and then move up 3 places (the Rise) and then move to the right 4 places (the Run) to reach the finishing point at (4,– 1). Rise Starting point We then joint these two points and continue the line to sketch the line y = Page | 10
Olympic College - Topic 7 Graphing a Linear Equation Example 4: Sketch the line y = using its slope and y-intercept. Solution: This line has a slope of m = y y= and a y-intercept of (0,3). Since the slope is 3 then Slope = Starting point Finishing point Rise Run this means that the Rise = – 2 and Run = 5. x We use the y-intercept of (0,3) as the starting point and then move down 2 places (the Rise) and then move to the right 5 place (the Run) to reach the finishing point at (5,1). We then joint these two points and continue the line to sketch the line y = Example 5: Sketch the line 2x – 4y = 6 using its slope and y-intercept. Solution: We begin by rearranging the equation of this line from its general form of 2x – 4y = 6 into its slope intercept form. y 2x – 4y = 12 – 4y –2x + 12 = = = This line has a slope of m = and a y-intercept of (0, 3). x 2x – 4y = 6 Since the slope is then Run Starting point Finishing point Rise Slope = this means that the Rise = 1 and Run = 2 We use the y-intercept of (0, 3) as the starting point and then move up one place (the Rise) and then move to the right 2 places (the Run) to reach the finishing point at (2, 2). We then joint these two points and continue the line to sketch the line 2x – 4y = 6 Page | 11
Olympic College - Topic 7 Graphing a Linear Equation y y Example 6: Sketch the line y = 4. Solution: This is a special situation as lines which have this form which contain no x term have a slope of 0. This line will have a y-intercept at (0,4) and a slope of zero. A slope of zero has a horizontal slope And will pass through the y-intercept (0,4). Example 7: Sketch the line x = – 3 Solution: This is a special situation as lines y =4 x which have this form do not have a y-intercept and a vertical slope. x To draw lines of this form we draw a a vertical line that passes through the x-axis at – 3. x = – 3 Exercise 1C: Draw each of the following lines by using their slopes and y-intercepts. y= – 5 y = 2x 1. 4. y=7 x= – 4 2. 5. 3. 6. x=3 y = – 3x y = 2x – 4 9. y = 4x – 7 7. 8. y = 3x + 2 10. y = 0 – 3x – 2 11. y = +5 12. y = +1 – 4 15. x + 5y = – 10 13. y = 14. 3x + 4y = 12 16. 2x – 4y = 12 18. x – 17. 18x + 8y = 16 = Page | 12
Olympic College - Topic 7 Graphing a Linear Equation 2 Finding the Equation of a Line There are two main methods for finding the equation of a line, they are. Using the slope and y-intercept. Using the slope and the coordinates of any point on the line. Method 1: The equation of the line that has a y-intercept of (0,b) and a slope of m is y = mx + b Example 1: Find the equation of the line with a slope of 4 and a y-intercept of (0,3) Solution: Slope = m = 4 and y-intercept b = 3 we get y = 4x + 3 We get the equation of the line is y = 4x + 3 Example 2: Find the equation of the line with a slope of – 5 and a y-intercept of (0,2) Slope = m = – 5 Solution: and y-intercept b = 2 We get the equation of the line is y = – 5x + 2 Example 3: Find the equation of the line with a slope of and passing through the origin. Solution: Slope = m = and y-intercept is (0,0) and so b = 0 We get the equation of the line is y = x Example 4: Find the equation of a horizontal line that has a y-intercept of (0,5) Solution: Slope = m = and y-intercept is (0,5) and so b = 5 We get the equation of the line is y = 0x + 5 which is y = 5 Page | 13
Olympic College - Topic 7 Graphing a Linear Equation Method 2: The equation of a line that passes through the point (x1,y1) with a slope of m can be found by using the formula. y – y1 = m(x – x1) Example 5: Find the equation of the line with a slope of 3 passing through the point (2,7) In this situation slope = m = 3 and the point (x1,y1) = (2,7) y – y1 y – 7 y – 7 y m(x – x1) 3(x – 2) 3x – 6 3x + 1 = = = = Replace the values for m and x1 and y1 Use the distributive law Add 7 to both sides Example 6: Find the equation of the line with a slope of – ½ passing through the point (– 4 ,9) In this situation slope = m = – ½ and the point (x1,y1) = (– 4 ,9) y – y1 y – 9 y – 9 y m(x – x1) – ½ (x + 4) – ½x – 2 – ½x + 7 = = = = Replace the values for m and x1 and y1 Use the distributive law Add 9 to both sides Example 7: Find the equation of the line with a slope of 0 passing through the point (– 1,– 4) In this situation slope = m = 0 and the point (x1,y1) = (– 1,– 4) y – y1 m(x – x1) = y+4 y+4 y = = = 0(x + 1) 0 – 4 Replace the values for m and x1 and y1 Use the distributive law Subtract 4 from both sides Example 8: Find the equation of the line passing through the points (2,4) and (– 3 ,14) To find the slope of the line that passes through the points (x1,y1) and (x2,y2) = – 2 we use the formula slope = m = = = In this situation slope = m = – 2 and the point (x1,y1) = (2 ,4) y – y1 y – 4 y – 4 y m(x – x1) – 2(x – 4) – 2x + 8 – 2x + 12 = = = = Replace the values for m and x1 and y1 Use the distributive law Add 4 to both sides Page | 14
Olympic College - Topic 7 Graphing a Linear Equation Example 9: Find the equation of the line passing through the points (– 3, – 4) and (– 5 , – 9) To find the slope of the line that passes through the points (x1,y1) and (x2,y2) we use the formula slope = m = = = = = and the point (x1,y1) = (– 3, – 4) In this situation slope = m = y – y1 m(x – x1) = y+4 y+4 y = = = (x + 3) x+ x+ Replace the values for m and x1 and y1 Use the distributive law Subtract 4 = from both sides Example 10: Find the equation of the line passing through the points (– 3, 0) and (– 2 , 5) To find the slope of the line that passes through the points (x1,y1) and (x2,y2) we use the formula slope = m = = = = =5 In this situation slope = m = 5 and the point (x1,y1) = (– 3, 0) y – y1 m(x – x1) = y+0 y = = 5 (x + 3) 5x + 15 Replace the values for m and x1 and y1 Use the distributive law Example 11: Find the equation of the line passing through the points (5, 4) and (5 , 9) To find the slope of the line that passes through the points (x1,y1) and (x2,y2) we use the formula slope = m = = = = undefined Since the slope is undefined we are looking at a vertical line that passes through the point (5,4). This is a special situation and all lines which are vertical have the equation x = a number in this case x = 5 Page | 15
Olympic College - Topic 7 Graphing a Linear Equation Example 12: Find the equation of the lines drawn below. y 5 4 3 2 y 3 4 1 2 1 -5 -4 -3 -2 -1 0 -1 x x 9 7 8 1 2 3 4 5 6 -2 -3 - 4-5 Solution: In order to find the equation of a sloping line we need to find the coordinates of two points on the line (any two points will do) Line 1: Since line is horizontal we can state its equation directly in this case it will be y = 4. Line 2: Two points on this line are (– 1, – 2) and (2 , 0) To find the slope of the line that passes through the points (x1,y1) and (x2,y2) we use the formula slope = m = = = = and the point (x1,y1) = (– 1, – 2) In this situation slope = m = y – y1 m(x – x1) = y+2 y+2 = = (x + 1) x+ Replace the values for m and x1 and y1 Use the distributive law x – y = subtract 2 = from both sides Line 3: Since line is vertical we can state its equation directly in this case it will be x = – 6 Line 4: Two points on this line are (2, – 4) and (–2 , 2) To find the slope of the line that passes through the points (x1,y1) and (x2,y2) we use the formula slope = m = = = = = and the point (x1,y1) = (2, – 4) In this situation slope = m = y – y1 m(x – x1) = (x – 2) x+3 x – 1 y+4 y+4 y = = = Replace the values for m and x1 and y1 Use the distributive law subtract 4 from both sides Page | 16
Olympic College - Topic 7 Graphing a Linear Equation Method 3: There is another method that can be used to find the equation of a line when you know its slope and one point on the line. The examples below show this method in action. Example 13: Find the equation of the line with a slope of 4 that passes through the point (3, – 8) Solution: The method that we use is to start with the assumption that the equation of this line will eventually become y = mx + b where m is the slope and (0,b) is the y-intercept. Next, since the line has a slope = m = 4 we can replace this value into the equation of the line y = mx + b to get y = 4x + b. Next we use the fact that the point (x,y) = (3, – 8) lies on the line and by substituting the x and y coordinates into the equation y = 4x + b and solving for b we can get the final equation. y = 4x + b – 8 = – 8 = – 20 = 4(3) + b 12 + b b So the equation of the above line is y = 4x – 20 Example 14: Find the equation of the line that passes through the points (4, – 6) and (– 2, – 3) Solution: We start by finding the slope First we find the slope of the line that passes through the points (x1,y1) and (x2,y2) And to do this we use the formula slope = m = = = = = Next, since the line has a slope = m = equation of the line y = mx + b to get y = we can replace this value into the x + b. Next we use the fact that the point (x,y) = (4, – 6) lies on the line and by substituting the x and y coordinates into the equation y = for b we can get the final equation. x + b and solving y = x+b – 6 = – 6 = – 4 = +b – 2 +b b x – 4 So the equation of the above line is y = Page | 17
Olympic College - Topic 7 Graphing a Linear Equation Exercise 2: 1 5 Find the equation of each line with a Slope = – 1, passing through the point (0,3) Find the equation of each line with a Slope = , passing through the point (5,3) 1. 2. 2 3 , passing through the point (0, – 5) 3. Find the equation of each line with a Slope = Find the equation of each line with a Slope = –3, passing through the point (–2,2). Find the equation of each line with a Slope = 0, passing through the point (–7,3). Find the equation of each line with a Slope = 10, passing through the point (–2,0). Find the equation of each line passing through the points (–1,2) and (1,4) Find the equation of each line passing through the points (0,4) and (4,2) Find the equation of each line passing through the points (–3,3) and (0, –10) 4. 5. 6. 7. 8. 9. 10. Find the equation of each line passing through the points (2, –2) and (–1, –7) 11. Find the equation of each line passing through the points (–2, –3) and (–4, –5) 12. Find the equation of the lines drawn below. 3 y y 5 4 3 2 4 1 -5 -4 -3 -2 -1 0 x x 9 7 8 1 2 3 4 5 6 -1 -2 -3 -4 5 1 2 -5 6 Page | 18
Olympic College - Topic 7 Graphing a Linear Equation 3 Puzzle questions involving the Equation of a Line Example 1: Find the equation of the line that is parallel to the line 2x – 3y = 9 and passes through the point (3,6). To find the slope of the line 2x – 3y = 9 we rearrange it into its slope intercept form. Solution: 2x – 3y = 9 – 3y y –2x + 9 = = = subtract 2x from both sides divide both sides by – 3 This line has a slope of We are now going to find the slope of the line passing through the point (3,6) In this situation slope = m = and the point (x1,y1) = (3,6) y – y1 m(x – x1) = y – 6 y – 6 y (x – 3) x – 2 x+4 = = = Replace the values for m and x1 and y1 Use the distributive law add 6 to both sides Example 2: Find the equation of the line that is perpendicular to the line 2x – 3y = 9 and passes through the point (3,6). To find the slope of the line 2x – 3y = 9 we rearrange it into its slope intercept form using Example 1 we get y = To find the slope of the perpendicular line we use the property that m1 m2 = – 1 m1 m2 = – 1 Solution: – 1 ( ) m2 m2 = = We are now going to find the slope of the line passing through the point (3,6) In this situation slope = m = and the point (x1,y1) = (3,6) y – y1 m(x – x1) = y – 6 y – 6 (x – 3) x+ = = Replace the values for m and x1 and y1 Use the distributive law y = x+ add 6 = to both sides Page | 19
Olympic College - Topic 7 Graphing a Linear Equation Example 3: Are the lines with equation y = 2x – 2 and 2x + 4y = 9 parallel, perpendicular or neither. Solution: In order to answer this question we find the slopes of both lines. Line 1: y = 2x – 2 has a slope of 2 Line 2: 2x + 4y = 9 – 2x + 9 4y = = has a slope of y = these lines are perpendicular since The two lines have slopes 2 and m1 m2 = Example 4: Are the lines with equation y = – 4x + 6 and 12x + 3y = 8 parallel, perpendicular or neither. Solution: In order to answer this question we find the slopes of both lines. Line 1: y = – 4x + 6 has a slope of – 4 Line 2: 12x + 3y = 3y = = 8 – 12x + 8 has a slope of y = these lines are parallel since their slopes are The two lines have slopes and identical. Page | 20
Olympic College - Topic 7 Graphing a Linear Equation Exercise 3: Find the equation of the line that is parallel to the line 3x – 2y = 8 and passes through the point (1, – 7). Find the equation of the line that is perpendicular to the line 3x – 2y = 10 and passes through the point (2,0). Find the equation of the line that is parallel to the line 2x + 3y = 0 and passes through the point (0,2). Find the equation of the line that is perpendicular to the line 7x – 2y = – 8 and passes through the point (5,9). Find the equation of the line that is parallel to the line 7x – y = – 8 and passes through the point (2, –3). Find the equation of the line that is perpendicular to the line 7x – y = – 8 and passes through the point (2, –3). Are the lines with equation y = 2x – 2 and 2x + 4y = 9 parallel, perpendicular or neither. Are the lines with equation y = 4x + 3 and 3x + 2y = 9 parallel, perpendicular or neither. Are the lines with equation 2x – 2y = 0 and 2x + 4y = 0 parallel, perpendicular or neither. 1. 2. 3. 4. 5. 6. 7. 8. 9. 10. Are the lines with equation 4x – 3y = 7 and 8x – 6y = 7 parallel, perpendicular or neither. 11. The equation of the line that has the same slope as 4x – 10y = 24 and the same y-intercept as 12y + 72 = 15x. A. y = B. y = C. y = D. y = 12. The equation of the line that has the same slope as 4x – 10y = 24 and the same y-intercept as 12y + 72 = 15x. A. y = B. y = C. y = D. y = Page | 21
Olympic College - Topic 7 Graphing a Linear Equation 13. Match the equation with its graph. –7x + 7y = –49 y y A. C. 10 8 6 4 2 10 8 6 4 2 x x –10 –8 –6 –4 –2 –2 –10 –8 –6 –4 –2 –2 2 4 6 8 10 2 4 6 8 10 –4 –6 –8 –10 –4 –6 –8 –10 y y B. D. 10 8 6 4 2 10 8 6 4 2 x x –10 –8 –6 –4 –2 –2 –10 –8 –6 –4 –2 –2 2 4 6 8 10 2 4 6 8 10 –4 –6 –8 –10 –4 –6 –8 –10 Page | 22
Olympic College - Topic 7 Graphing a Linear Equation Solutions: Exercise 1A: 1. 2. 3. – 6 – 3 – 3 – 2 x 0 – 1 3 0 6 1 y= 4. – 10 – 5 – 5 – 3 x 0 – 1 5 1 10 3 y= 5. – 6 – 5 – 3 – 3 x 0 – 1 3 1 6 3 y= Draw the line has with the equation 2x – 3y = 12 using the table of values below. Draw the line has with the equation 4x + 2y = 8 using the table of values below. 6. 7. Page | 23
Olympic College - Topic 7 Graphing a Linear Equation Exercise 1B: Draw each of the following lines by first finding their x and y-intercepts. y = 2x – 7 y = 7x + 21 y-intercept = – 7 y-intercept = 21 1. 2. x-intercept = x-intercept = – 3 x-intercept = – 3 x-intercept = 3. 4. y= y= +6 +9 y-intercept = 6 y-intercept = 9 – 9 – 9 5. y= x-intercept = 12 y-intercept = 6. 7. 8. 9. 2x + 4y = 8 10x + 5y = – 5 2x – 4y = 12 18x + 3y = 9 x-intercept = 4 x-intercept = x-intercept = 6 x-intercept = y-intercept y-intercept y-intercept y-intercept = = = = 2 – 1 – 3 3 4x – y-intercept = – 8 10. = x-intercept = Exercise 1C: Draw each of the following lines by using their slopes and y-intercepts. 1. 2. 3. 4. y=7 y= – 5 x=3 x= – 4 Slope = 0 (horizontal) Slope = 0 (horizontal) Slope = undefined (vertical) Slope = undefined (vertical) y-intercept = 7 y-intercept = – 5 y-intercept = does not exist y-intercept = does not exist 5. 6. 7. 8. 9. 10. y = 2x y = – 3x y = 2x – 4 y = 3x + 2 y = 4x – 7 y = – 3x – 2 Slope = 2 Slope = – 3 Slope = 2 Slope = 3 Slope = 4 Slope = – 3 y-intercept = 0 y-intercept = 0 y-intercept = – 4 y-intercept = 2 y-intercept = – 7 y-intercept = – 2 11. y= +5 Slope = y-intercept = 5 12. y = 13. y = +1 – 4 Slope = Slope = y-intercept = 1 y-intercept = – 4 14. 3x + 4y = 12 15. x + 5y = – 10 16. 2x – 4y = 12 17. 18x + 8y = 16 Slope = Slope = Slope = Slope = y-intercept = 3 y-intercept = – 2 y-intercept = – 3 y-intercept = 2 18. x – = Slope = y-intercept = Page | 24
Olympic College - Topic 7 Graphing a Linear Equation Exercise 2: 1. y= 2. y = 3. y = 4. y= 5. 7. 8. 9. 10. 11. y= Slope = m = 1 Slope = m = Slope = m = Slope = m = 3 Slope = m = 1 6. y = equation of line y = equation of line y = equation of line y = equation of line y = equation of line y = 12. Line 1: Line 2: Line 3: Line 4: Line 5: Line 6: Slope = m = Slope = m = – 2 Slope = m = undefined Slope = m = Slope = m = Slope = m = equation of line y = equation of line y = equation of line x = 8 equation of line y = equation of line y = equation of line y = Exercise 3: point (1, – 7) point (2, 0) point (0, 2) point (5, 9) 1. 2. 3. 4. slope = m = slope = m = slope = m = slope = m = equation of line y = equation of line y = equation of line y = equation of line y = slope = m = 7 point (2, –3). slope = m = 7 point (2, –3). slope = m1 = 2 slope = m2 = slope = m1 = 4 slope = m2 = slope = m1 = 1 slope = m2 = 5. 6. 7. 8. 9. equation of line y = equation of line y = Lines are perpendicular Lines are neither Lines are neither Lines are parallel 10. slope = m1 = slope = m2 = 11. A 12. A 13. A Page | 25