Download
1 / 75
750 likes | 754 Views
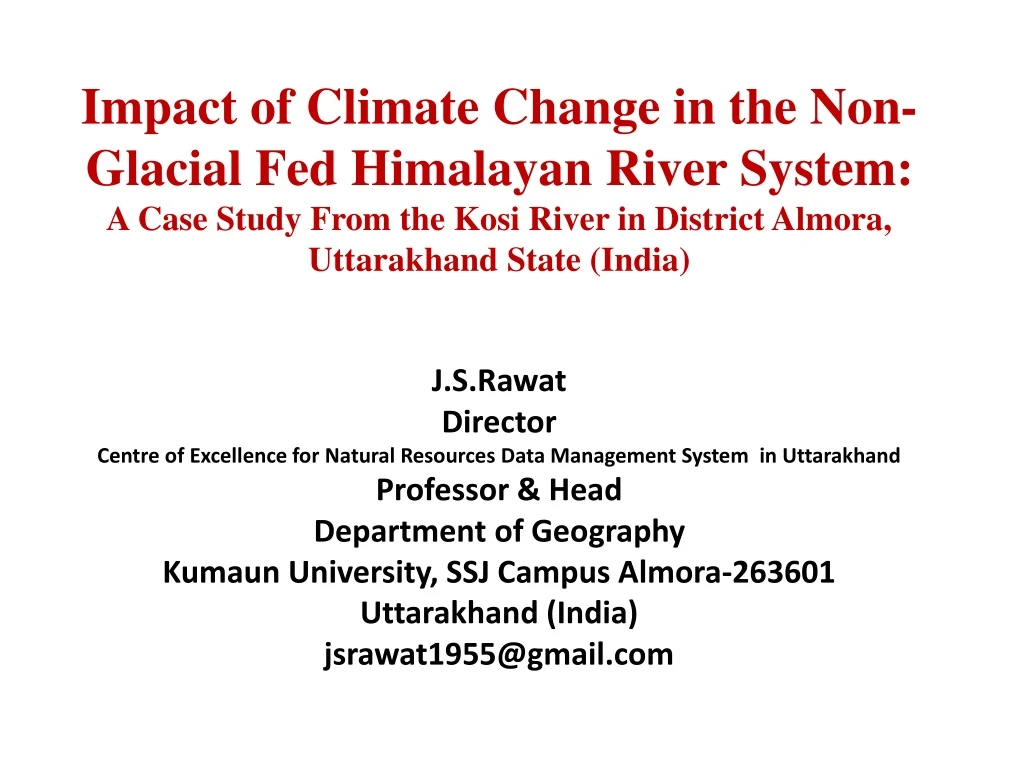
Impact of Climate Change in the Non-Glacial Fed Himalayan River System: A Case Study From the Kosi River in District Almora, Uttarakhand State (India) J.S.Rawat Director Centre of Excellence for Natural Resources Data Management System in Uttarakhand Professor & Head

E N D
Impact of Climate Change in the Non-Glacial Fed Himalayan River System: A Case Study From the Kosi River in District Almora, Uttarakhand State (India) J.S.Rawat Director Centre of Excellence for Natural Resources Data Management System in Uttarakhand Professor & Head Department of Geography Kumaun University, SSJ Campus Almora-263601 Uttarakhand (India) jsrawat1955@gmail.com
IMPRINTS OF CLIMATE CHANGE IN UTTARAKHAND • 1. Increase in temperature • Reduction in snow cover area • Steady recession of glaciers • Diminishing regulatory effect of glaciers • Shifting of vegetation line • Development of pro-glacial lakes • Increasing trend of drought years • Transformation of glacial fed rivers • Increase in Annual Rainfall • 10. Decrease in winter, summer and post • monsoon rains • 11. Increase in monsoon rains • 12. Reduction in annual rainy days • 13. Change in rainfall rhythm
IMPRINTS OF CLIMATE CHANGE IN UTTARAKHAND • 14. Transformation of perennial streams • 15. Diminishing length of perennial streams • 16. Dwindling of summer discharge in rivers • 17 Phonological changes • 18. Reductions in crop production • 19. Shifting of apple belt • 20. Reduction in production of fruits • 21 Impact in pest spectrum • 22 Invasion of xerophytes plant roileana • 23. Developments of palm tree colonies
Zoom This Watershed with details of 1992 Select Excremental Watershed Salla Rautela
IMPACTS OF CLIMATE CHANGE 9. Increase in Annual Rainfall 10. Increase in Monsoon Rain Rainfall 11. Decrease in winter, summer and post monsoon rains 12. Drastic decrease in rainy days 13. Transformation of perennial stream to non- perennial stream 14. Dwindling of summer discharge 15. Increase in runoff 16. Change in rainfall rhythm
ANNUAL RAINFALL:INCREASING TREND Average Annual Rf 1004mm
Rainy Days (Average 94 Days/yr) (Almora 1955-80 :135 Days/yr)
RAINY DAYS TREND :ANNUAL Avg. 94 days/yr Almora 25 km East Almora Avg. 125 days/yr (1955-1980)
Annual Discharge/Rainy Days/Rainfall Rainy Days
Change in Rainfall Rhythm Annual Hyetograph ( Peak July)
Transformation of Perennial Streams to Non-Perennial Streams
NON-GLACIAL FED RIVER RESIGM • Transformation of Perennial Streams to Non- • Perennial Streams