Download
1 / 1
10 likes | 220 Views
A High Resolution Accurate Mass Targeted Approach for N-Linked Glycopeptides Screening and Quantitation using a Hybrid Quadrupole Orbitrap Mass Spectrometer

E N D
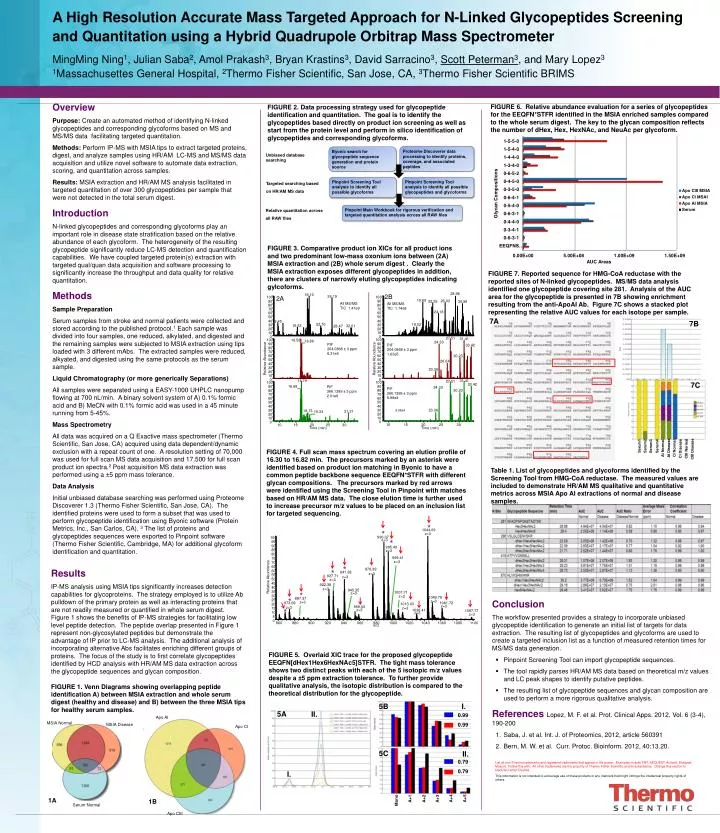
A High Resolution Accurate Mass Targeted Approach for N-Linked Glycopeptides Screening and Quantitation using a Hybrid Quadrupole Orbitrap Mass Spectrometer MingMing Ning1, Julian Saba2, Amol Prakash3, Bryan Krastins3, David Sarracino3, Scott Peterman3, and Mary Lopez31Massachusettes General Hospital, 2Thermo Fisher Scientific, San Jose, CA, 3Thermo Fisher Scientific BRIMS Overview Purpose: Create an automated method of identifying N-linked glycopeptides and corresponding glycoforms based on MS and MS/MS data facilitating targeted quantitation. Methods: Perform IP-MS with MSIA tips to extract targeted proteins, digest, and analyze samples using HR/AM LC-MS and MS/MS data acquisition and utilize novel software to automate data extraction, scoring, and quantitation across samples. Results: MSIA extraction and HR/AM MS analysis facilitated in targeted quantitation of over 300 glycopeptides per sample that were not detected in the total serum digest. Introduction N-linked glycopeptides and corresponding glycoforms play an important role in disease state stratification based on the relative abundance of each glycoform. The heterogeneity of the resulting glycopeptide significantly reduce LC-MS detection and quantification capabilities. We have coupled targeted protein(s) extraction with targeted qual/quan data acquisition and software processing to significantly increase the throughput and data quality for relative quantitation. Methods Sample Preparation Serum samples from stroke and normal patients were collected and stored according to the published protocol.1 Each sample was divided into four samples, one reduced, alkylated, and digested and the remaining samples were subjected to MSIA extraction using tips loaded with 3 different mAbs. The extracted samples were reduced, alkyated, and digested using the same protocols as the serum sample. Liquid Chromatography (or more generically Separations) All samples were separated using a EASY-1000 UHPLC nanopump flowing at 700 nL/min. A binary solvent system of A) 0.1% formic acid and B) MeCN with 0.1% formic acid was used in a 45 minute running from 5-45%. Mass Spectrometry All data was acquired on a Q Exactive mass spectrometer (Thermo Scientific, San Jose, CA) acquired using data dependent/dynamic exclusion with a repeat count of one. A resolution setting of 70,000 was used for full scan MS data acquisition and 17,500 for full scan product ion spectra.2 Post acquisition MS data extraction was performed using a ±5 ppm mass tolerance. Data Analysis Initial unbiased database searching was performed using Proteome Discoverer 1.3 (Thermo Fisher Scientific, San Jose, CA). The identified proteins were used to form a subset that was used to perform glycopeptide identification using Byonic software (Protein Metrics, Inc., San Carlos, CA). 3 The list of proteins and glycopeptides sequences were exported to Pinpoint software (Thermo Fisher Scientific, Cambridge, MA) for additional glycoform identification and quantitation. FIGURE 6. Relative abundance evaluation for a series of glycopeptides for the EEQFN*STFR identified in the MSIA enriched samples compared to the whole serum digest. The key to the glycan composition reflects the number of dHex, Hex, HexNAc, and NeuAc per glycoform. FIGURE 2. Data processing strategy used for glycopeptide identification and quantitation. The goal is to identify the glycopeptides based directly on product ion screening as well as start from the protein level and perform in silico identification of glycopeptides and corresponding glycoforms. 28.98 19.16 2B 26.19 2A 100 100 19.69 26.03 90 22.55 90 30.98 All MS/MS TIC 1.74e8 All MS/MS TIC 1.41e9 80 80 70 70 24.18 60 60 Proteome Discoverer data processing to identify proteins, coverage, and associated peptides Byonic search for glycopeptide sequence generation and protein source 50 50 Unbiased database searching 40 40 9.45 18.02 30 22.70 30 15.53 32.01 28.47 20 20 10 10 0 0 27.51 31.41 100 100 16.58 24.33 16.86 90 PIF 204.0868 ± 3 ppm 1.63e5 PIF 204.0868 ± 3 ppm 6.31e6 33.42 90 Pinpoint Screening Tool analysis to identify all possible glycoforms Pinpoint Screening Tool analysis to identify all possible glycopeptides and glycoforms 80 80 Targeted searching based on HR/AM MS data 70 70 60 30.23 60 Relative Abundance 50 Relative Abundance 26.64 50 40 40 30 23.36 30 20 20 Pinpoint Main Workbook for rigorous verification and targeted quantitation analysis across all RAW files 10 Relative quantitation across all RAW files 10 0 31.41 27.51 0 100 16.79 33.42 100 90 24.33 PIF 366.1399 ± 3 ppm 8.98e4 PIF 366.1399 ± 3 ppm 2.01e6 16.68 90 80 30.23 80 70 70 60 60 50 50 40 40 8.98e4 23.36 30 30 18.73 31.21 20 FIGURE 3. Comparative product ion XICs for all product ions and two predominant low-mass oxonium ions between (2A) MSIA extraction and (2B) whole serum digest . Clearly the MSIA extraction exposes different glycopeptides in addition, there are clusters of narrowly eluting glycopeptides indicating gylcoforms. 19.33 20 10 10 0 10 15 20 25 30 0 Time (min) 10 15 20 25 30 Time (min) FIGURE 7. Reported sequence for HMG-CoA reductase with the reported sites of N-linked glycopeptides. MS/MS data analysis identified one glycopeptide covering site 281. Analysis of the AUC area for the glycopeptide is presented in 7B showing enrichment resulting from the anti-ApoAI Ab. Figure 7C shows a stacked plot representing the relative AUC values for each isotope per sample. 7A 7B * 1044.09 * z=3 990.07 100 7C z=3 * 95 90 995.40 FIGURE 4. Full scan mass spectrum covering an elution profile of 16.30 to 16.82 min. The precursors marked by an asterisk were identified based on product ion matching in Byonic to have a common peptide backbone sequence EEQFN*STFR with different glycan compositions. The precursors marked by red arrows were identified using the Screening Tool in Pinpoint with matches based on HR/AM MS data. The close elution time is further used to increase precursor m/z values to be placed on an inclusion list for targeted sequencing. 85 z=3 80 999.41 75 z=3 70 65 * Table 1. List of glycopeptides and glycoforms identified by the Screening Tool from HMG-CoA reductase. The measured values are included to demonstrate HR/AM MS qualitative and quantitative metrics across MSIA Apo AI extractions of normal and disease samples. 976.39 * 60 941.38 z=3 55 927.71 z=3 Relative Abundance 50 z=3 45 922.38 40 z=3 945.35 35 1007.71 * z=3 30 z=3 1049.76 Serum1 Serum2 Serum4 887.37 Serum3 * 25 AI Normal AI Disease CI Normal CIII Normal CI Disease CIII Disease z=3 z=3 1061.72 873.69 1013.03 20 z=3 959.03 z=3 z=3 15 * z=3 1030.41 1097.77 10 z=3 z=3 5 0 860 880 900 920 940 960 980 1000 1020 1040 1060 1080 1100 m/z Results IP-MS analysis using MSIA tips significantly increases detection capabilities for glycoproteins. The strategy employed is to utilize Abpulldown of the primary protein as well as interacting proteins that are not readily measured or quantified in whole serum digest. Figure 1 shows the benefits of IP-MS strategies for facilitating low level peptide detection. The peptide overlap presented in Figure 1 represent non-glycosylated peptides but demonstrate the advantage of IP prior to LC-MS analysis. The additional analysis of incorporating alternative Abs facilitates enriching different groups of proteins. The focus of the study is to first correlate glycopeptides identified by HCD analysis with HR/AM MS data extraction across the glycopeptide sequences and glycan composition. 0.99 0.99 0.79 0.79 • Conclusion • The workflow presented provides a strategy to incorporate unbiased glycopeptide identification to generate an initial list of targets for data extraction. The resulting list of glycopeptides and glycoforms are used to create a targeted inclusion list as a function of measured retention times for MS/MS data generation. • Pinpoint Screening Tool can import glycopeptide sequences. • The tool rapidly parses HR/AM MS data based on theoretical m/z values and LC peak shapes to identify putative peptides. • The resulting list of glycopeptide sequences and glycan composition are used to perform a more rigorous qualitative analysis. • References Lopez, M. F. et al. Prot. Clinical Apps. 2012, Vol. 6 (3-4), 190-200 • Saba, J. et al. Int. J. of Proteomics, 2012, article 560391 • Bern, M. W. et al. Curr. Protoc. Bioinform. 2012, 40:13.20. FIGURE 5. Overlaid XIC trace for the proposed glycopeptide EEQFN[dHex1Hex6HexNAc5]STFR. The tight mass tolerance shows two distinct peaks with each of the 5 isotopic m/z values despite a ±5 ppm extraction tolerance. To further provide qualitative analysis, the isotopic distribution is compared to the theoretical distribution for the glycopeptide. FIGURE 1. Venn Diagrams showing overlapping peptide identification A) between MSIA extraction and whole serum digest (healthy and disease) and B) between the three MSIA tips for healthy serum samples. 5B I. Apo AI 5A II. MSIA Normal MSIA Disease Apo CI 5C II. List all non-Thermo trademarks and registered trademarks that appear in the poster. Examples include TMT, SEQUEST, ActiveX, Eksignet, Mascot. Follow this with: All other trademarks are the property of Thermo Fisher Scientific and its subsidiaries. Change this section to black text when finished. This information is not intended to encourage use of these products in any manners that might infringe the intellectual property rights of others. I. 1A 1B Serum Normal A+4 A+5 A+1 A+2 A+3 Mono Apo CIII