Download
1 / 1
10 likes | 159 Views
Using an Equine Pasture Evaluation Disk (EPED) to Document Canopy Cover and Evaluate Pasture Improvement Donna Foulk*, Ann Swinker, Marvin Hall, Helene McKernan; Pennsylvania State University, University Park, Pennsylvania 16802. Abstract # 129. Objective.

E N D
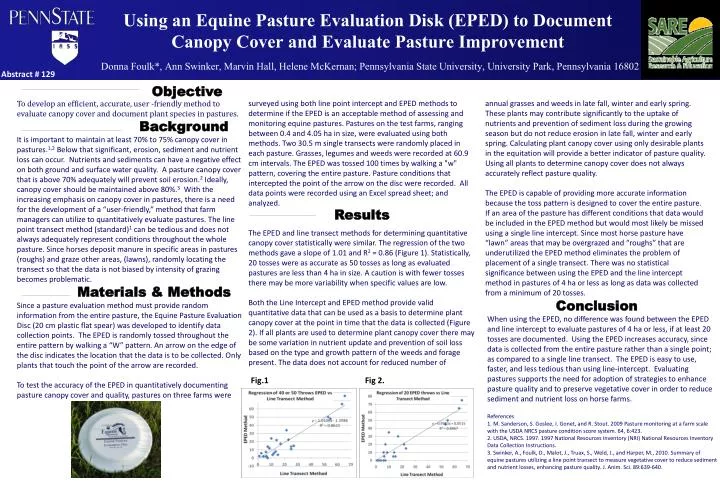
Using an Equine Pasture Evaluation Disk (EPED) to Document Canopy Cover and Evaluate Pasture ImprovementDonna Foulk*, Ann Swinker, Marvin Hall, Helene McKernan; Pennsylvania State University, University Park, Pennsylvania 16802 Abstract # 129 Objective To develop an efficient, accurate, user -friendly method to evaluate canopy cover and document plant species in pastures. Background It is important to maintain at least 70% to 75% canopy cover in pastures.1,2 Below that significant, erosion, sediment and nutrient loss can occur. Nutrients and sediments can have a negative effect on both ground and surface water quality. A pasture canopy cover that is above 70% adequately will prevent soil erosion.2 Ideally, canopy cover should be maintained above 80%.3 With the increasing emphasis on canopy cover in pastures, there is a need for the development of a “user-friendly,” method that farm managers can utilize to quantitatively evaluate pastures. The line point transect method (standard)1 can be tedious and does not always adequately represent conditions throughout the whole pasture. Since horses deposit manure in specific areas in pastures (roughs) and graze other areas, (lawns), randomly locating the transect so that the data is not biased by intensity of grazing becomes problematic. Materials & Methods Since apasture evaluation method must provide random information from the entire pasture, the Equine Pasture Evaluation Disc (20 cm plastic flat spear) was developed to identify data collection points. The EPED is randomly tossed throughout the entire pattern by walking a “W” pattern. An arrow on the edge of the disc indicates the location that the data is to be collected. Only plants that touch the point of the arrow are recorded. To test the accuracy of the EPED in quantitatively documenting pasture canopy cover and quality, pastures on three farms were surveyed using both line point intercept and EPED methods to determine if the EPED is an acceptable method of assessing and monitoring equine pastures. Pastures on the test farms, ranging between 0.4 and 4.05 ha in size, were evaluated using both methods. Two 30.5 m single transects were randomly placed in each pasture. Grasses, legumes and weeds were recorded at 60.9 cm intervals. The EPED was tossed 100 times by walking a "w" pattern, covering the entire pasture. Pasture conditions that intercepted the point of the arrow on the disc were recorded. All data points were recorded using an Excel spread sheet; and analyzed. The EPED and line transect methods for determining quantitative canopy cover statistically were similar. The regression of the two methods gave a slope of 1.01 and R2 = 0.86 (Figure 1). Statistically, 20 tosses were as accurate as 50 tosses as long as evaluated pastures are less than 4 ha in size. A caution is with fewer tosses there may be more variability when specific values are low. Both the Line Intercept and EPED method provide valid quantitative data that can be used as a basis to determine plant canopy cover at the point in time that the data is collected (Figure 2). If all plants are used to determine plant canopy cover there may be some variation in nutrient update and prevention of soil loss based on the type and growth pattern of the weeds and forage present. The data does not account for reduced number of annual grasses and weeds in late fall, winter and early spring. These plants may contribute significantly to the uptake of nutrients and prevention of sediment loss during the growing season but do not reduce erosion in late fall, winter and early spring. Calculating plant canopy cover using only desirable plants in the equitation will provide a better indicator of pasture quality. Using all plants to determine canopy cover does not always accurately reflect pasture quality. The EPED is capable of providing more accurate information because the toss pattern is designed to cover the entire pasture. If an area of the pasture has different conditions that data would be included in the EPED method but would most likely be missed using a single line intercept. Since most horse pasture have “lawn” areas that may be overgrazed and “roughs” that are underutilized the EPED method eliminates the problem of placement of a single transect. There was no statistical significance between using the EPED and the line intercept method in pastures of 4 ha or less as long as data was collected from a minimum of 20 tosses. Results Conclusion When using the EPED, no difference was found between the EPED and line intercept to evaluate pastures of 4 ha or less, if at least 20 tosses are documented. Using the EPED increases accuracy, since data is collected from the entire pasture rather than a single point; as compared to a single line transect. The EPED is easy to use, faster, and less tedious than using line-intercept. Evaluating pastures supports the need for adoption of strategies to enhance pasture quality and to preserve vegetative cover in order to reduce sediment and nutrient loss on horse farms. Fig.1 Fig 2. References1. M. Sanderson, S. Goslee, I. Gonet, and R. Stout. 2009 Pasture monitoring at a farm scale with the USDA NRCS pasture condition score system. 64, 6:423. 2. USDA, NRCS. 1997. 1997 National Resources Inventory (NRI) National Resources Inventory Data Collection Instructions.3. Swinker, A., Foulk, D., Malot, J., Truax, S., Weld, J., and Harper, M., 2010. Summary of equine pastures utilizing a line point transect to measure vegetative cover to reduce sediment and nutrient losses, enhancing pasture quality. J. Anim. Sci. 89:639-640.