Download
1 / 39
390 likes | 538 Views
Northern Hemisphere: Weather & Climate over Major Crops Areas. Update prepared by Climate Prediction Center / NCEP 7 October 2009. For Real-time information: http://www.cpc.noaa.gov/products/JAWF_Monitoring/. Outline. Highlights ENSO Current Status MJO Current Status

E N D
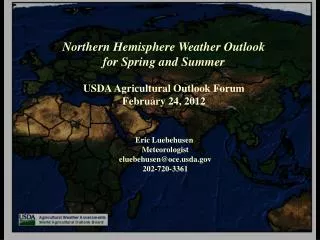
Northern Hemisphere: Weather & Climate over Major Crops Areas Update prepared by Climate Prediction Center / NCEP 7 October 2009 For Real-time information: http://www.cpc.noaa.gov/products/JAWF_Monitoring/
Outline • Highlights • ENSO Current Status • MJO Current Status • Monsoons Current Status • Northern Hemisphere Circulation • Rainfall & Temperature Patterns • NCEP/GFS Model Forecast • Forecast Verification
Highlights • North America: Moderate to heavy rain fell across the northern US plains and south-central US. The GFS forecast calls for precipitation in the northwest US and south-central US in the next 7 days. • Mexico and Central America: Precipitation was above average in northwest Mexico and below average in southern Mexico. The GFS forecast calls for below average precipitation in northwest Mexico and above average precipitation in central Mexico. • Eurasia: Precipitation fell in eastern Europe, while heavier showers impacted south Asia, southeast Asia, and tropical activity brought rain to Luzon. The GFS forecast calls for precipitation in eastern Europe, and below average precipitation in South Asia and eastern China.
ENSO Current Status • General Summary: • El Niño is present across the equatorial Pacific Ocean. • Sea surface temperatures (SST) were at least 1.0ºC above-average across parts of the central and east-central equatorial Pacific. • Based on current observations and dynamical model forecasts, El Niño is expected to strengthen and last through Northern Hemisphere winter 2009-10. During the last 4-weeks (6 Sep – 3 Oct 2009), equatorial SSTs were at least 1.0°C above average across parts of the central and eastern Pacific. For more information go to: http://www.cpc.noaa.gov/products/precip/CWlink/MJO/enso.shtml
MJO Index -- Recent Evolution Ensemble GFS (GEFS) MJO Forecast • The axes (RMM1 and RMM2) represent daily values of the principal components from the two leading modes • The triangular areas indicate the location of the enhanced phase of the MJO • Counter-clockwise motion is indicative of eastward propagation. Large dot most recent observation. • Distance from the origin is proportional to MJO strength • Line colors distinguish different months RMM1 and RMM2 values for the most recent 40 days and forecasts from the ensemble Global Forecast System (GEFS) for the next 15 days light gray shading: 90% of forecasts dark gray shading: 50% of forecasts Yellow Lines – 20 Individual Members Green Line – Ensemble Mean MJO Current Status The amplitude of the MJO index has decreased during the previous week, indicating little to no MJO signal. The GEFS forecasts of the MJO index indicate a weak MJO signal continuing through week 1, with a strengthening signal by week 2. For more information go to: http://www.cpc.noaa.gov/products/precip/CWlink/MJO/mjo.shtml
Northern Hemisphere Monsoons Current Status North America West Africa East Asia Rainfall Anomalies: Last 90 Days Rainfall Anomalies: Last 90 Days Rainfall Anomalies: Last 90 Days During the last 90 days near to below average rainfall has occurred over southwest US. During the last 90 days above average rainfall has occurred in west Africa near Senegal and Guinea. Below average rainfall has occurred in the coastal Gulf of Guinea region and Sudan. During the last 90 days below average rainfall has occurred in central India, parts of eastern China and Indonesia (Borneo and Java). Above average rainfall has occurred in the Philippines due in part to tropical cyclone activity. For more information go to: http://www.cpc.noaa.gov/products/Global_Monsoons/
200-hPa, 925-hPa Wind & Temperature Anomalies- Recent 7 days Northern Hemisphere Circulation A C Low-level (~600 m) wind and temperature anomalies are based on the NCEP Climate Data Assimilation Systems (CDAS) analysis. The patterns of anomalous temperature and wind at 925-hPa are usually similar to surface observations. Note: Areas with surface pressure below 925-hPa are masked out. • During the 7-day period (29 Sep – 5 Oct 2009), anomalous 200-hPa an anticyclonic circulation center was located west of North America and a cyclonic circulation center was located in the North Atlantic. • Below-average temperatures were observed over the east central US, while above-average temperatures were observed over central Russia and eastern Asia.
Omega Anomalies and Total Precipitation - Recent 7 days Northern Hemisphere Circulation Rising motion (negative omega, yellow/red shading), usually associated with wetter- than-normal conditions. Sinking motion (positive omega, blue shading), usually associated with drier-than-normal conditions. CPC daily gridded precipitation analysis over land only. The daily gauge analysis is created on a 0.5 degree lat/lon over the global land by interpolating gauge observations from ~30,000 stations. • During 29 Sep – 5 Oct 2009, anomalous rising motion (negative omega) were observed over portions of Canada, the southeast US, India, and from the Philippines up to Japan (top panel red ovals). • Above average precipitation was observed over many of the same areas including Canada, the southeast US, India, and southeast Asia.
North America • Rainfall Total & Anomaly Patterns • Temperature Patterns • GFS Forecast
Rainfall Total & Anomaly Patterns: Last 7 Days Total Anomaly During the last 7 days, rainfall was above average in the northern US plains and south-central US. Dry weather prevailed in the mid Atlantic region of the US, and rainfall was below average in the Alaskan panhandle.
Rainfall Total & Anomaly Patterns: Last 15 Days Total Anomaly During the last 15 days, precipitation was above average in the western US Corn Belt and southeast US. Heavy rain occurred in the southeast US during the third week of September.
Rainfall Total & Anomaly Patterns: Last 30 Days Total Anomaly During the last 30 days, rainfall was below average in parts of Alaska, the Great Lakes region, and parts of eastern Canada. Rainfall was above average in the Dakotas and the southeast. Heavy rainfall in mid September helped break September rainfall records in Georgia and North Carolina.
Recent Evolution: RainfallLast 30 Days 30 day rainfall totals are above average in the south central US, near average in the northwest and below average in Northern California and Florida.
Temperature (°C)Based on GTS Stations (no QC) Anomaly Extreme Minimum During the 27 Sep – 3 Oct, temperatures were below average across most of Canada. Low temperatures reached the single digits (degrees C) while some areas dropped below freezing. A season ending freeze occurred the previous week throughout most of the Canadian prairies (not shown). Anomaly Extreme Minimum
Temperature (°C)Based on GTS Stations (no QC) Anomaly Extreme Minimum During the 27 Sep- 3 Oct temperature were below average across most of the US except for parts of the extreme south. Minimum temperatures were below 40 degrees F in the high plains, Rockies, and New England. Minimum temperature dropped below 30 degrees F in the upper Midwest and the Rockies. In Mexico temperatures were slightly above average with low temperatures in the teens. Anomaly Extreme Minimum
NCEP/GFS Precipitation Forecasts Forecasts from 7 Oct 2009 – Days 1-7 Total Anomaly For Days 1-7 above average rainfall is forecast for southwest Alaska and the east-central US, and below average rainfall is forecast for the upper Midwest.
NCEP/GFS Precipitation Forecasts Forecasts from 7 Oct 2009 – Week 2 Total Anomaly For Days 8-14 above average rainfall is predicted for the northwest US, and below average rainfall is predicted for southern Alaska and the southeast US coast.
Forecast from 23 Sep 2009 Valid 30 Sep – 6 Oct 2009 Forecast from 30 Sep 2009 Valid 30 Sep – 6 Oct 2009 Observed Valid 30 Sep – 6 Oct 2009 Forecast VerificationNorth America
Mexico and Central America • Rainfall Total & Anomaly Patterns • Temperature Patterns • GFS Forecast
Rainfall Total & Anomaly Patterns: Last 7 Days Total Anomaly During the past 7 days, precipitation was above average in northwest Mexico after being dry the previous week. Precipitation was below average in southern Mexico.
Rainfall Total & Anomaly Patterns: Last 15 Days Total Anomaly During the past 15 days, precipitation was above average in northwest Mexico, eastern Honduras and eastern Nicaragua and below average in the Yucatan.
Rainfall Total & Anomaly Patterns: Last 30 Days Total Anomaly During the past 30 days, precipitation was above average in central Mexico and below average in the Yucatan.
Recent Evolution: RainfallLast 30 Days 30 day rainfall totals are above average in north central Mexico and below average in southern Mexico and western Nicaragua.
NCEP/GFS Precipitation Forecasts Forecasts from 7 Oct 2009 – Week 1 Total Anomaly For Days 1-7 below average precipitation is predicted for northwest Mexico and the Yucatan, and above average precipitation is predicted for central and eastern Mexico.
NCEP/GFS Precipitation Forecasts Forecasts from 7 Oct 2009 – Week 2 Total Anomaly For Days 8-14 below average precipitation is predicted for most of Central America except for Costa Rica and northern Panama where above average precipitation is predicted.
Forecast from 23 Sep 2009 Valid 30 Sep – 6 Oct 2009 Forecast from 30 Sep 2009 Valid 30 Sep – 6 Oct 2009 Observed Valid 30 Sep – 6 Oct 2009 Forecast VerificationCentral America
Eurasia • Rainfall Total & Anomaly Patterns • Temperature Patterns • GFS Forecast
Rainfall Total & Anomaly Patterns: Last 7 Days Total Anomaly During the past 7 days, precipitation was above average in India, Indochina, and the northern Philippines. Typhoon Parma contributed to heavy rainfall in the Philippines. Mostly dry weather prevailed in central Europe and western Africa.
Rainfall Total & Anomaly Patterns: Last 15 Days Total Anomaly During the past 15 days, precipitation was above average in northern Algeria and Tunisia, India, the Philippines and parts of Indonesia. Luzon was impacted by both Tropical Storm Ketsana and Typhoon Parma in the past two weeks. Precipitation was below average in north and central Europe, and eastern China.
Rainfall Total & Anomaly Patterns: Last 30 Days Total Anomaly During the past 30 days, precipitation was above average in northwest Africa, parts of India, and the Philippines, while precipitation was below average in most of Europe, parts of western Russia, and eastern China.
Recent Evolution: RainfallLast 30 Days 30 day rainfall totals are below average in most of central Europe, while Mediterranean regions are closer to normal.
Temperature (°C)Based on GTS Stations (no QC) Anomaly Extreme Minimum During 27 Sep – 3 Oct temperatures were near to above average in Europe with lows in the single digits (degrees C). In northwest Africa temperatures were near to below average. Anomaly Extreme Minimum
Temperature (C)Based on GTS Stations (no QC) Anomaly Extreme Minimum During 27 Sep – 3 Oct temperatures were near average in Russia. Extreme minimum temperature ranged from -5 to 5 degrees C in most areas. Anomaly Extreme Minimum
Recent Evolution: RainfallLast 30 Days 30 day rainfall totals are below average in Gujarat, near average in south central India, below average in Manchuria, and above average in Luzon (tropical activity).
Temperature (C)Based on GTS Stations (no QC) Anomaly Extreme Minimum During 27 Sep – 3 Oct temperatures were above average in most of South Asia except for southern India and above average in eastern Asia. Extreme minimum temperatures in the Manchuria were in the 0-5 degrees C range. Anomaly Extreme Minimum
NCEP/GFS Precipitation Forecasts Forecasts from 7 Oct 2009 – Week 1 Total Anomaly For Days 1-7 forecasts show above average precipitation in northeast Europe, parts of western Russia, and Indonesia. Below average precipitation is predicted in India, eastern China, and western Africa.
NCEP/GFS Precipitation Forecasts Forecasts from 7 Oct 2009 – Week 2 Total Anomaly For Days 8-14 below average precipitation is expected to continue in India, parts of southeast Asia, and western Africa, and below average precipitation is also expected in western Europe.
Forecast from 23 Sep 2009 Valid 30 Sep – 6 Oct 2009 Forecast from 30 Sep 2009 Valid 30 Sep – 6 Oct 2009 Observed Valid 30 Sep – 6 Oct 2009 Forecast VerificationEurasia
Major World Crop Areas and Climate Profiles Crop Calendars by Month http://www.usda.gov/oce/weather/pubs/Other/MWCACP http://www.usda.gov/oce/weather/CropCalendars USDA Crop Information