Download
1 / 24
240 likes | 426 Views
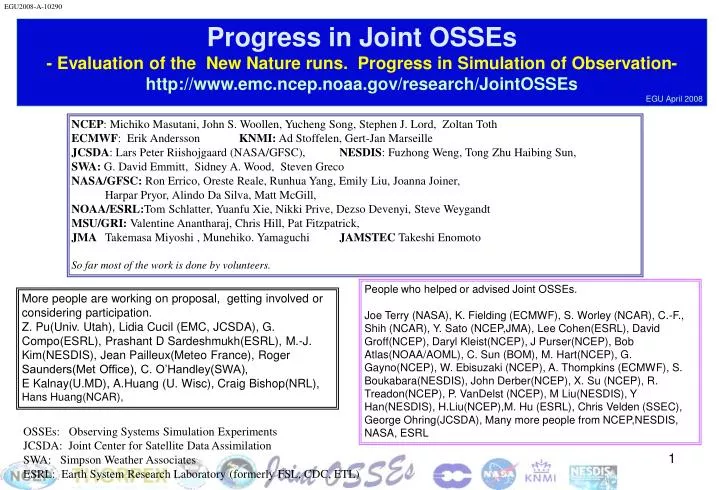
EGU2008-A-10290. OSSEs: Observing Systems Simulation Experiments JCSDA: Joint Center for Satellite Data Assimilation SWA: Simpson Weather Associates ESRL: Earth System Research Laboratory ( formerly FSL, CDC, ETL). Progress in Joint OSSEs

E N D
EGU2008-A-10290 OSSEs: Observing Systems Simulation Experiments JCSDA: Joint Center for Satellite Data Assimilation SWA: Simpson Weather Associates ESRL: Earth System Research Laboratory(formerly FSL, CDC, ETL) Progress in Joint OSSEs - Evaluation of the New Nature runs. Progress in Simulation of Observation- http://www.emc.ncep.noaa.gov/research/JointOSSEs EGU April 2008 NCEP: Michiko Masutani, John S. Woollen, Yucheng Song, Stephen J. Lord, Zoltan Toth ECMWF: Erik Andersson KNMI: Ad Stoffelen, Gert-Jan Marseille JCSDA: Lars Peter Riishojgaard (NASA/GFSC), NESDIS: Fuzhong Weng, Tong Zhu Haibing Sun, SWA: G. David Emmitt, Sidney A. Wood, Steven Greco NASA/GFSC: Ron Errico, Oreste Reale, Runhua Yang, Emily Liu, Joanna Joiner, Harpar Pryor, Alindo Da Silva, Matt McGill, NOAA/ESRL:Tom Schlatter, Yuanfu Xie, Nikki Prive, Dezso Devenyi, Steve Weygandt MSU/GRI: Valentine Anantharaj, Chris Hill, Pat Fitzpatrick, JMA Takemasa Miyoshi , Munehiko. Yamaguchi JAMSTEC Takeshi Enomoto So far most of the work is done by volunteers. People who helped or advised Joint OSSEs. Joe Terry (NASA), K. Fielding (ECMWF), S. Worley (NCAR), C.-F., Shih (NCAR), Y. Sato (NCEP,JMA), Lee Cohen(ESRL), David Groff(NCEP), Daryl Kleist(NCEP), J Purser(NCEP), Bob Atlas(NOAA/AOML), C. Sun (BOM), M. Hart(NCEP), G. Gayno(NCEP), W. Ebisuzaki (NCEP), A. Thompkins (ECMWF), S. Boukabara(NESDIS), John Derber(NCEP), X. Su (NCEP), R. Treadon(NCEP), P. VanDelst (NCEP), M Liu(NESDIS), Y Han(NESDIS), H.Liu(NCEP),M. Hu (ESRL), Chris Velden (SSEC), George Ohring(JCSDA), Many more people from NCEP,NESDIS, NASA, ESRL More people are working on proposal, getting involved or considering participation. Z. Pu(Univ. Utah), Lidia Cucil (EMC, JCSDA), G. Compo(ESRL), Prashant D Sardeshmukh(ESRL), M.-J. Kim(NESDIS), Jean Pailleux(Meteo France), Roger Saunders(Met Office), C. O’Handley(SWA), E Kalnay(U.MD), A.Huang (U. Wisc), Craig Bishop(NRL), Hans Huang(NCAR),
Need for OSSEs Benefit of OSSEs ♦Quantitatively–based decisions on the design and implementation of future observing systems ♦ Evaluate possible future instruments without the costs of developing, maintaining & using observing systems. ●OSSEs help in understanding and formulating observational errors ●DA (Data Assimilation) system will be prepared for the new data ●Enable data formatting and handling in advance of “live” instrument ● OSSE results also showed that theoretical explanations will not be satisfactory when designing future observing systems. If we cannot simulate observations, how could we assimilate observations? Need for collaboration Need one good new Nature Run which will be used by many OSSEs, including regional data assimilation. Share the simulated data to compare the OSSE results from various DA systems to gain confidence in results. OSSEs require many experts and require a wide range of resources. Extensive international collaboration within the Meteorological community is essential for timely and reliable OSSEs to influence decisions.
Archive and Distribution New Nature Run by ECMWF Based on discussion with JCSDA, NCEP, GMAO, GLA, SIVO, SWA, NESDIS, ESRL, and ECMWF To be archived in the MARS system on the THORPEX server at ECMWF Accessed by external users. Currently available internally as expver=etwu Copies for US are available to designated users for research purpose& users known to ECMWF Saved at NCEP, ESRL, and NASA/GSFC Complete data available from portal at NASA/GSFC Conctact:Michiko Masutani (michiko.masutani@noaa.gov), Harper.Pryor@nasa.gov Low Resolution Nature Run Spectral resolution : T511 Vertical levels: L91 3 hourly dump Initial conditions: 12Z May 1st, 2005 Ends at: 0Z Jun 1,2006 Daily SST and ICE: provided by NCEP Model: Version cy31r1 Supplemental low resolution regular lat lon data 1degx1deg for T511 NR, 0.5degx0.5deg for T799 NR Pressure level data:31 levels, Potential temperature level data: 315,330,350,370,530K Selected surface data for T511 NR: Convective precip, Large scale precip, MSLP,T2m,TD2m, U10,V10, HCC, LCC, MCC, TCC, Sfc Skin Temp Complete surface data for T799 NR T511 verification data is posted from NCAR CISL Research Data Archive. Data set ID ds621.0. Currently NCAR account is required for access. T799 verification data are available from NASA/GSFC portal (Contact Harper.Pryor@nasa.gov) (Also available from NCEP hpss, ESRL, NCAR/MMM, NRL/MRY, Univ. of Utah, JMA,Mississippi State Univ.) Two High Resolution Nature Runs 35 days long Hurricane season: Starting at 12z September 27,2005, Convective precipitation over US: starting at 12Z April 10, 2006 T799 resolution, 91 levels, one hourly dump Get initial conditions from T511 NR Note: This data must not be used for commercial purposes and re-distribution rights are not given. User lists are maintained by Michiko Masutani and ECMWF
Comparison between the ECMWF T511 Nature Run against climatology 20050601-20060531, exp=eskb, cycle=31r1 Adrian Tompkins, ECMWF NR TechMemo 452 Tompkins et al. (2004) ftp://ftp.emc.ncep.noaa.gov/exper/mmasutani/ECMWF_NR_Diag/Tompkins_ECMWF_T511_diag/tm452.pdf Jung et al. (2005) TechMemo 471 http://www.emc.ncep.noaa.gov/research/osse/NR/ECMWF_T511_diag/tm471.pdf Plot files are also posted at ftp://ftp.emc.ncep.noaa.gov/exper/mmasutani/ECMWF_NR_Diag/Tompkins_ECMWF_T511_diag The description of the data ftp://ftp.emc.ncep.noaa.gov/exper/mmasutani/ECMWF_NR_Diag/Tompkins_ECMWF_T511_diag/climplot_README.html Xie Arkin NR-Xie_Arkin Cloud Cover Red: NR Black:Xie Arkin NR - These comparisons confirm the lack of rainfall over the tropical land masses. - We have an overestimation of precip over the high-SST regions in the tropics. - There is a tendency for deep convection to become locked in with the highest SSTs, which in the east Pacific results in a narrow ITCZ. - The TRMM NASDA-3b43 algorithm is presumed to be the most accurate of the two TRMM retrieval products. MODIS NR-MODIS
Evaluation of the European Centre for Medium-Range Weather Forecasts’ (ECMWF) Nature Run: midlatitude cyclone activity; tropical Atlantic and African MonsoonOreste Reale NASA/GSFC/GLAJoe Terry NASA/GSFC/SIVO Midlatitude Cyclone Diagnostics • Diagnostics produced: • Tracks • Lifespan • Distribution by central pressure • Deepening rate • Mean direction and speed (total, zonal and meridional speed) • Cyclone, genesis and lysis density • Statistical properties of the atmospheric flow, particularly midlatitude cyclone activity, are investigated • In the tropics however, it is crucial the assess the presence of fundamental features of tropical weather systems • Until few years ago, to search for evidence of tropical weather in a global model was not possible and only large-scale, diluted large-scale features could be detected • Goals: • Identify any trends or biases • Identify any conspicuous anomalies and determine source • Assess realism
Utilize Goddard’s cyclone tracking software (Terry and Atlas, AMS conf, Aug 1996): • Identifies and tracks mostly extratropical cyclones (cutoff at 20 deg N/S latitude) • Interfaces with GrADS contouring algorithm • Uses SLP field at 4hPa contour interval • Finds centroid of inner-most closed isobar • Tracks the centers using extrapolation and 500hPa steering • Cyclone tracks generated: • Nature run at one degree for Jun 2005 to May 2006 (each month and season) • NCEP operational analysis at one degree for 2000 to 2006 (each month, 68 of 84 months were available)
Cyclogenesis density from NCEP reanalysis over Southern Hemisphere. (Simmonds and Keay, Journal of Climate, March 2000) Nature Run diagnostics (J. Terry, NASA/GSFC/SIVO) • Statistical properties of midlatitude cyclone activity have been proved very satisfactory
Nature Run Atlantic tropical cyclone seasonOreste Reale NASA/GSFC/GLA • Fundamental dynamical featuresassociated to the climate-weather interface generally present in the tropical atmosphere, are searched in the Nature Run. Focus is the AMMA region and the tropical Atlantic • African Easterly Jet, African Waves, Tropical Cyclones track (and their complexity), Tropical Cyclone structure are investigated • Reale, O., J. Terry, M. Masutani, E. Andersson, L. P. Riishojgaard, J. C. Jusem, 2007: Preliminary evaluation of the European Centre for Medium-Range Weather Forecasts (ECMWF) Nature Run over the Tropical Atlantic and African Monsoon region. Geophysical Research Letters, 34, L22810, doi:10.1029/2007GL31640. • First Nature Run to simulate one entire season • Twelve tropical cyclones develop • Realistic variability of tracks • Most intense reaches 957 hPa • Binary vortices, looping and singularities are observed (good from OSSE perspective) Five`Early recurvers’ appear in the season. Three central-Atlantic TCs with convincing Extra-tropical transitions, and 3 systems of the Gulf. Overall, very realistic track variability. Early recurvers are more than climatology but not unseen. Four early recurving systems in an active season, 2004 (NHC).
Realistic Variability of TCL system tracks in the Atlantic Wind speed (m/s) Temp (oC) Vort (s-1) Looping and Binary vortex interaction Vertical structure of a TC 2 vortex shows, even at the degraded resolution of 1 deg, a distinct eye-like feature and a very prominent warm core. 4 systems: Looping, Binary vortex Interaction, Extratropical Transitions and Extra-tropical Re-intensification Singuarities, binary vortex Interactions, Intensity fluctuations Due to large-scale forcing fluctuations Vertical structure of TC11 shows another example of eye-like feature and a very prominent warm core. Structure even more impressive than the TC2. Low-level wind speed exceeds 55 m/s; vorticity max In the lower levels.
The African Easterly Jet (AEJ) September Jul-Aug MJJA • Intensity (11m/s) compares well with observed climatology (e.g Burpee 1972 and operational analyses for the period) • Realistic clear separation between AEJ and low-level Harmattan flow • Realistically well-defined low level westerly flow • Moderate horizontal cyclonic shear on the southern flank of the AEJ, increasing towards the end of the analyzed period • The AEJ appears at the `perfect’ climatological elevation (650hPa) but is slightly more to the north with respect to climatology and analyses • Intensity (11m/s) compares well with observed climatology (e.g Burpee 1972 and operational analyses for the period) • Realistic clear separation between AEJ and low-level Harmatthan flow at 20E • Weaker than climatology low-level westerly monsoonal flow • Reduced vertical easterly shear due to reduction of the TEJ at 150 hPa with respect to Jul-Aug • Strong horizontal cyclonic shear on the southern flank of the AEJ, leads to condition much more favorable to tropical development • July and August means show a northward displacement of the AEJ, gradual intensifcation of the Harmatthan flow and of the low-level monsoonal flow. • Realistically well-defined low level westerly monsoonal flow in agreement with obs (e.g. Asnani 2005) • Realistically intense horizontal cyclonic shear on the southern flank of the AEJ in July and Aug • Tropical Easterly Jet at 200-150 hPa is stronger than climatology, thus creating higher-than-observed vertical easterly shear, which appears to inhibit the early development of AEWs attempting to become vortices
October Comparison with NCEP op. Analyses for Sep 2005 January • October shows a realistic receding of the African monsoon • A realistic weakening of the AEJ, but also of the easterly vertical shear is evident • Tropical Easterly Jet at 200-150 hPa follows climatology, reducing vertical shear and allowing several AEWs to become vortices in spite of reduced horizontal shear in the southern flank of the AEJ The AEJ has a realistic maximum of 11 m/s at 600 hPa but wind speed are too low at 750 and 700 hPa consistently with the altitude bias. Meridional shear of zonal wind is realistic and supportive of barotropic instability. September Nature Run October The AEJ has a perfectly realistic maximum of 11 m/s at 600 hPa in September and gradually weakens in October following climatology. NCEP operational analyses
Example of nondev. AEW due to Easterly Shear Tropical Easterly Jet (TEJ) at 150hPa • The TEJ controls the easterly vertical shear that may inhibit early stages of development. • It is a planetary scale feature connected with the Asian Monsoon • Fluctuations on interannual scale are known (Chen and van Loon, 1987) but intraseasonal variations, despite their importance, are still little known • Eastward retreat of strong easterly speed (40 m/s or higher) throughout the monsoon season, produces decreased vertical easterly shear over the Atlantic and an increasingly favorable environment for development • The NR shows a stronger than climatology TEJ, but a very credible and realistic decrease of easterly speed with the progress of the monsoon season. As a consequence, the environment becomes conducive to more development 850hpa Vort (sh) 650 hPa flow In the early stages, 850 hPa vort. increases and vort max becomes aligned with 650hPa circulation center. Eventually upper-level easterly shear suppresses development. The potentially favorable situation induced by a vertically aligned structure between 800 and 500 hPa at 12-14N is counteracted by easterly vertical shear of the order of 20 m/s.
Concluding remarks on the African Monson region and tropical Atlantic African Easterly Waves (AEWs) • A synoptic assessment of the NR over the AM region and the tropical Atlantic shows an overall very realistic African Monsoon, AEJ and wave activity • Several weak tropical and sub-tropical systems are present, together with `major’ tropical cyclones • In spite of a tendency of creating several early recurvers, it can be stated that the NR, given the resolution limitation, does have a very good representativeness of tropical cyclone track variability in the Atlantic, as it would occur in an active season • This Nature Run represents a very promising tool to perform OSSEs over the tropical Atlantic CURRENT and FUTURE WORK at NASA GSFC (GLA, GMAO, JCSDA and SIVO) on the NR validation • Comprehensive statistics on midlatitude cyclone activity have been performed • Analysis of tropical weather over Indian Ocean and Asian Monsoon regions with emphasis on the Somali Jet, monsoon onset and breaks, tropical depressions, together with an assessment of the Eastern Pacific tropical cyclone, Southern Hemisphere and WPacific seasons is being completed • Results from this comprehensive assessment to be submitted as a journal article during 2008 AEWs show a realistic propagation speed of about 5-9 deg/day, comparable to analyses. Moreover, there is a period of about six weeks in which the majority of waves present signs of development. This is similar to what happens in very active seasons. The disappearance from the Hovm relates to changes in latitude.
Case Events Identified from ECMWF T799NRChristopher M. Hill, Patrick J. Fitzpatrick, Valentine G. Anantharaj Mississippi State University (Plotted from 1x1 data) Comparison of zonal mean zonal wind jet maxima, NR and ECMWF analysis, Northern Hemisphere By Nikki Prive, ESRL blue – ECMWF green star – Nature Run Evaluation of Cloud Simpson weather associates Nikki Prive also presented realistic Rossby wave and many good storms to test T-PARC experiments
Quick look of T799 NR period T511 vs T799 in 1deg Michiko Masutan (NOAA/NCEP/EMC)
Simulation of Observation OBS91L Nature Run Model level profiles for simulating radiance obs Jack Woollen (EMC) Simulation of Conventional ObservationsJack Woollen (NCEP/EMC) Sat wind was included to provide reasonable fields for SH Radiation data are not included. Initial data will have no error added and quality control is not necessary. For development purposes, 91-level ML variables are processed at NCEP and interpolated to observational locations with all the information need to simulate radiance data (OBS91L). OBS91L made for all foot prints of HIRS, AMSU, GOES are produced for a few weeks of the T799 period in October 2005 As well as for the month of May 2005. OBS91L are produced for all radiance foot prints assimilated in operational GDAS as recorded in the archived “radstat” files. The OBS91L are also available for development of a Radiative Transfer Model (RTM) for development of other forward model. Considerations Data distribution depends on atmospheric conditions Cloud and Jet location, Surface orography, RAOB drift Simulation of Observaional Error Ron Errico NASA/GSFC/GMAO Precursor run with Conventional DataYuanfu Xie (NOAA/ESRL), Jack Woollen (EMC), Michiko Masutani(EMC), Yucheng Song(EMC) T62L64 or T126 L64 is used in the experiment for entire period for T511 NR using perfect observation without quality control. This will to test the OSSE system and provide initial condition for other OSSEs.
Radiance Simulation System for OSSEGMAO, NESDIS, NCEPRon Errico, Runhua Yang, Emily Liu, Lars Peter Riishojgaard, Ravi Govindaraju (NASA/GSFC/GMAO)Tong Zhu,Fuzhong Weng, Haibing Sun(NOAA/NESDIS)Jack Woollen(NOAA/NCEP) Other possible resources and/or advisors David Groff , Paul Van Delst (NCEP) Yong Han,Walter Wolf, Cris Bernet,, Mark Liu, M.-J. Kim, Tom Kleespies, (NESDIS) Erik Andersson (ECMWF); Roger Saunders (Met Office) NASA/GMAO is developing best strategies to simulate and work on more complete foot prints. This include development of cloud clearing algorithm. NESDIS and NCEP are working on thinned data to perform precursor run for entire period. (seeking for resources) Sample full resolution data for GOES for cloudy radiance are also produced by Tong Zhu. Existing instruments experiments must be simulated for control and calibration and development of DAS and RTM and to test GOESR,NPOESS, and other future satellite data
Simulation of GOES-R ABI radiances for OSSE Tong Zhu et al. :5GOESR P1.31 at AMS annual meeting http://www.emc.ncep.noaa.gov/research/JointOSSEs/publications/AMS_Jan2008/Poster-88thAMS2008-P1.31-OSSEABI.ppt Simulated from T511 NR. GOES data will be simulated to investigate its data impact
More Simulation of Observations This list show the capabilities. Not all the activities are funded. Simulation of DWLKNMI, SWA, NASA/GSFC, Ball(?) Simulation Radiance data to be evaluated by OSSEsGMAO,NESDIS,MSU,JCSDA, UW/SSEC and more Unmanned Air Craft System (UAS) NOAA/ESRL Cloud Motion Vectors SWA - Advised by Chris Velden - Uniform Raob for testing DAS EMC Scatterometer KNMI
OSSEs planned Funded or seeking funding but starting with volunteers OSSEs to investigate data impact of GOES and preparation for GOES-R NESDIS, EMC OSSE to evaluate DWL KNMI,SWA,EMC, GMAO, NOAA/ESRL, and more OSSE to evaluate UAS ESRL and NCEP OSSEs for THORPEX T-PARC EMC, FSU, ESRL Regional OSSEs to Evaluate ATMS and CrIS Observations GRI/Mississippi State Univ (MSU), JCSDA
Various planned OSSE-related activities Visualization of the Nature run Jibo Sanyal (MSS), O. Reale (NASA/GSFC/GLA), H. Mitchell(NASA/GSFC/SIVO) Sensor Web NASA/GSFC/SIVO, SWA Assimilation with LETKF possibly by 4D-var T. Miyoshi(JMA) and T. Enomoto(JEMSTEC) Analysis with surface pressure Gil Compo, P. D. Sardeshmukh (ESRL) Identical twin experiments It is worthwhile to try identical twin experiments to understand model error. Identical twin OSSEs can be only used for illustration only . ECMWF offered to perform identical twin OSSEs if there is specific goals. (Erik Andersson)
Projects being considered or seeking funding and various possibilities Regional OSSEs to evaluate DWL Zhaoxia Pu,Univ of Utah OSSE to design configuration of GPS Lidia Cucurull,JCSDA,EMC Evaluation data assimilation system Ron Errico, GMAO Simulation of ASCAT QuickScat XOVMM Scatterometer Ad Stoffelen, KNMI Evaluation of RAOB Drift Erik Andersson,EMCWF Evaluation of Drift Buoy Jean Pailleux, Meteo France More possibilities: Evaluation of retrieval program Simulating Gestational DWL, Ball Use OSSEs for training and education. Targeted Observation using LETKF Eugenia Kalnay, UMCP
Getting ready for OSSEs • ♦ Produce perfect data and run calibration experiments • ♦ Design representativeness error and observational error and redo calibration • ♦ Development of standard verification package • ♦ Clarify potential and limitations of OSSE and educate community • ♦ Meso/Regional OSSEs • Joint OSSE team agreed we have to concentrate on OSSEs with existing NRs to study superobbed data impact of high resolution data. However, there are strong demands for mesoscale OSSEs. Joint OSSE team is working on integrating mesoscale OSSE interest. • ♦ Coordination of work • - Uniform representation of observational data and results • - Keep track who actually did the work and various contributions • - Organizing publication • OSSE Chapter in Data Assimilation book from Springer • Introductory article in BAMS
Requirements for a future Nature Run - Some suggestions - We need to avoid many poorly planned and assessed nature run ♦ The NWP model must have good forecast skill. Great visualization does not guarantee good forecast skill. ♦ At least a 3 month lower resolution run with the same model is required to provide a spin-up period for bias correction. ♦ Must have a good TC or a severe storm in the Nature Run period. ♦ Sufficient number of vertical levels: Minimum 91 levels ♦ Some degree of coupling with the ocean and land surface ♦ If it is regional, the effect of the lateral boundary must be evaluated. ♦ A list of verification methods must be produced by Joint OSSE. ♦ Need NR to be shared within Joint OSSE ♦ User friendly archive