Download
1 / 46
990 likes | 1.96k Views
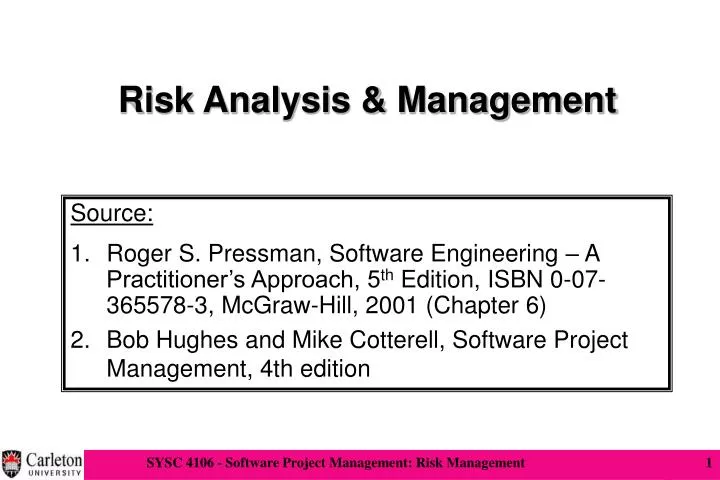
Risk Analysis & Management. Source: Roger S. Pressman, Software Engineering – A Practitioner’s Approach, 5 th Edition, ISBN 0-07-365578-3, McGraw-Hill, 2001 (Chapter 6) Bob Hughes and Mike Cotterell, Software Project Management, 4th edition. Risk management. This lecture will touch upon:

E N D
Risk Analysis & Management • Source: • Roger S. Pressman, Software Engineering – A Practitioner’s Approach, 5th Edition, ISBN 0-07-365578-3, McGraw-Hill, 2001 (Chapter 6) • Bob Hughes and Mike Cotterell, Software Project Management, 4th edition
Risk management This lecture will touch upon: • Definition of ‘risk’ and ‘risk management’ • Some ways of categorizing risk • Risk management • Risk identification – what are the risks to a project? • Risk analysis – which ones are really serious? • Risk planning – what shall we do? • Risk monitoring – has the planning worked? • We will also look at PERT risk and critical chains
Some definitions of risk ‘The chance of exposure to the adverse consequences of future events’ • Project plans have to be based on assumptions • Risk is the possibility that an assumption is wrong • When the risk happens it becomes a problem or an issue
Overview • Risks are potential problems that might affect the successful completion of a software project. • Risks involve uncertainty and potential losses. • Risk analysis and management are intended to help a software team understand and manage uncertainty during the development process. • The important thing is to remember that things can go wrong and to make plans to minimize their impact when they do. • The work product is called a Risk Mitigation, Monitoring, and Management Plan (RMMM).
Risk Component & Drivers The risk components are defined in the following manner: • Performance risk—the degree of uncertainty that the product will meet its requirements and be fit for its intended use. • Cost risk—the degree of uncertainty that the project budget will be maintained. • Support risk—the degree of uncertainty that the resultant software will be easy to correct, adapt, and enhance. • Schedule risk—the degree of uncertainty that the project schedule will be maintained and that the product will be delivered on time. The impact of each risk driver on the risk component is divided into one of four impact categories—negligible, marginal, critical, or catastrophic
Reactive project team reacts to risks when they occur mitigation—plan for additional resources in anticipation of fire fighting fix on failure—resource are found and applied when the risk strikes crisis management—failure does not respond to applied resources and project is in jeopardy Proactive formal risk analysis is performed organization corrects the root causes of risk TQM concepts and statistical SQA examining risk sources that lie beyond the bounds of the software developing the skill to manage change Risk Management
Risk Check List • Product size (PS)—risks associated with the overall size of the software to be built or modified. • Business impact (BU)—risks associated with constraints imposed by management or the marketplace. • Customer characteristics (CU)—risks associated with the sophistication of the customer and the developer's ability to communicate with the customer in a timely manner. • Process definition (PR)—risks associated with the degree to which the software process has been defined and is followed by the development organization. • Development environment (DE) —risks associated with the availability and quality of the tools to be used to build the product. • Technology to be built (TE)—risks associated with the complexity of the system to be built and the "newness" of the technology that is packaged by the system. • Staff size and experience (ST)—risks associated with the overall technical and project experience of the software engineers who will do the work.
Risk Projection & Building a Risk Table • Risk projection, also called risk estimation, attempts to rate each risk in two ways - the likelihood or probability that the risk is real and - the consequences of the problems associated with the risk, should it occur. • The project planner, along with other managers and technical staff, performs four risk projection activities: • establish a scale that reflects the perceived likelihood of a risk, • delineate the consequences of the risk, • estimate the impact of the risk on the project and the product, and • note the overall accuracy of the risk projection so that there will be no misunderstandings.
Building Risk Table – table 2 RMMM = Risk Mitigation, Monitoring and Management Plan
Assessing Risk Impact The following steps are recommended to determine the overall consequences of a risk: • Determine the average probability of occurrence value for each risk component. • Using table 1 (slide 10) determine the impact for each component based on the criteria shown. • Complete the risk table and analyze the results The overall risk exposure, RE, is determined using the following relationship: RE = PxC where P is the probability of occurrence for a risk, and C is the the cost to the project should the risk occur.
Example Assume that the software team defines a project risk in the following manner: Risk identification. Only 70 percent of the software components scheduled for reuse will, in fact, be integrated into the application. The remaining functionality will have to be custom developed. Risk probability. 80% (likely). Risk impact. 60 reusable software components were planned. If only 70 percent can be used, 18 components would have to be developed from scratch (in addition to other custom software that has been scheduled for development). Since the average component is 100 LOC and local data indicate that the software engineering cost for each LOC is $14.00, the overall cost (impact) to develop the components would be 18 x 100 x 14 = $25,200. Risk exposure. RE = 0.80 x 25,200 ~ $20,200.
Risk Assessment • For assessment to be useful, a risk referent level must be defined. • In the context of software risk analysis, a risk referent level has a single point, called the referent point or break point, at which the decision to proceed with the project or terminate it (problems are just too great) are equally weighted.
In reality, the referent level can rarely be represented as a smooth line on a graph. In most cases it is a region in which there are areas of uncertainty; that is, attempting to predict a management decision based on the combination of referent values is often impossible. Therefore, during risk assessment, we perform the following steps: • Define the risk referent levels for the project. • Attempt to develop a relationship between each (ri, li, xi) and each of the referent levels. (where ri = risk, li = probability of the risk, and xi = impact of the risk) • Predict the set of referent points that define a region of termination, bounded by a curve or areas of uncertainty. • Try to predict how compound combinations of risks will affect a referent level.
Risk Decision Tree • A technique that can be used to visualize the risks of alternatives is to build a risk decision tree. • The top-level branch splits based on the alternatives available. The next split is based on the probabilities of events happening. Each leaf node has the risk exposure for that event. The sum of risks exposure for all leafs under a top-level split gives the total risk exposure for that choice. • Example – A friend offers to play one of two betting games with you. Game A is that you toss a coin twice. He pays you $10 if you get two heads. You pay him $2 for each tail you toss. Game B is that you also toss a coin twice, but it costs you $2 to play and he pays you $10 if you get two heads. Which game should you play?
The risk decision tree is shown below. Both games total to $0.50. Thus, each time you play, your average again is 50cents. No matter which game you choose.
A framework for dealing with risk The planning for risk includes these steps: • Risk identification – what risks might there be? • Risk analysis and prioritization – which are the most serious risks? • Risk planning – what are we going to do about them? Risk monitoring – what is the current state of the risk?
Risk identification Approaches to identifying risks include: • Use of checklists – usually based on the experience of past projects (previous slides) • Brainstorming – getting knowledgeable stakeholders together to pool concerns • Causal mapping – identifying possible chains of cause and effect
Risk prioritization Risk exposure (RE) = (potential damage) x (probability of occurrence) Ideally • Potential damage: a money value e.g. a flood would cause $0.5 millions of damage • Probability 0.00 (absolutely no chance) to 1.00 (absolutely certain) e.g. 0.01 (one in hundred chance) RE = $0.5m x 0.01 = $5,000 • Crudely analogous to the amount needed for an insurance premium
Qualitative descriptors of impact on cost and associated range values
Risk planning Risks can be dealt with by: • Risk acceptance (previous slides) • Risk avoidance (previous slides) • Risk reduction • Risk transfer • Risk mitigation/contingency measures
Risk reduction leverage Risk reduction leverage (RRL) = (REbefore- REafter)/ (cost of risk reduction) REbeforeis risk exposure before risk reduction e.g. 1% chance of a fire causing $200k damage REafter is risk exposure after risk reduction e.g. fire alarm costing $500 reduces probability of fire damage to 0.5% RRL = (1% of $200k)-(0.5% of $200k)/$500 = 2 RRL > 1.00 therefore worth doing
Using PERT to evaluate the effects of uncertainty Three estimates are produced for each activity • Most likely time (m) • Optimistic time (a) • Pessimistic (b) • ‘expected time’ te = (a + 4m +b) / 6 • ‘activity standard deviation’ S = (b-a)/6
A chain of activities Task A Task B Task C
A chain of activities • What would be the expected duration of the chain A + B + C? • Answer: 12.66 + 10.33 + 25.66 i.e. 48.65 • What would be the standard deviation for A + B+ C? • Answer: square root of (12 + 12 + 32) i.e. 3.32
Assessing the likelihood of meeting a target • Say the target for completing A+B+C was 52 days (T) [from slide 34] • Calculate the z value thus z = (T – te)/s • In this example z = (52-48.33)/3.32 i.e. 1.01 • Look up in table of z values – see next overhead
Critical chain approach One problem with estimates of task duration: • Estimators add a safety zone to estimate to take account of possible difficulties • Developers work to the estimate + safety zone, so time is lost • No advantage is taken of opportunities where tasks can finish early – and provide a buffer for later activities
Critical chain approach One answer to this: • Base targets on midpoints (i.e. te) • Accumulate 50% of the safety zones (between te and b) into a buffer at the end of the project • Work backwards and start all activities at their latest start dates • During project execution use relay race model
Attributes that affect risk: • estimated size of the product in LOC or FP? • estimated size of product in number of programs, files, transactions? • percentage deviation in size of product from average for previous products? • size of database created or used by the product? • number of users of the product? • number of projected changes to the requirements for the product? before delivery? after delivery? • amount of reused software? Risk Due to Product Size
• effect of this product on company revenue? • visibility of this product by senior management? • reasonableness of delivery deadline? • number of customers who will use this product • interoperability constraints • sophistication of end users? • amount and quality of product documentation that must be produced and delivered to the customer? • governmental constraints • costs associated with late delivery? • costs associated with a defective product? Risk Due to Business Impact Attributes that affect risk:
Risks Due to the Customer Questions that must be answered: • Have you worked with the customer in the past? • Does the customer have a solid idea of requirements? • Has the customer agreed to spend time with you? • Is the customer willing to participate in reviews? • Is the customer technically sophisticated? • Is the customer willing to let your people do their job—that is, will the customer resist looking over your shoulder during technically detailed work? • Does the customer understand the software engineering process?
Risks Due to Process Maturity Questions that must be answered: • Have you established a common process framework? • Is it followed by project teams? • Do you have management support for software engineering • Do you have a proactive approach to SQA? • Do you conduct formal technical reviews? • Are CASE tools used for analysis, design and testing? • Are the tools integrated with one another? • Have document formats been established?
Technology Risks Questions that must be answered: • Is the technology new to your organization? • Are new algorithms, I/O technology required? • Is new or unproven hardware involved? • Does the application interface with new software? • Is a specialized user interface required? • Is the application radically different? • Are you using new software engineering methods? • Are you using unconventional software development methods, such as formal methods, AI-based approaches, artificial neural networks? • Are there significant performance constraints? • Is there doubt the functionality requested is "do-able?"