Download
1 / 97
1.05k likes | 1.39k Views
Cost-benefit analysis in Disaster Risk Management. Cees van Westen westen@itc.nl. Disaster management cycle. Components: relief, recovery, reconstruction, prevention and preparedness. Initially most emphasis was given to disaster relief, recovery and reconstruction

E N D
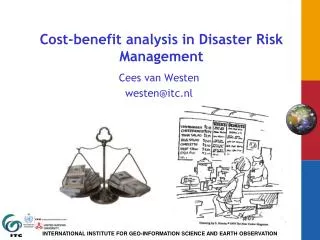
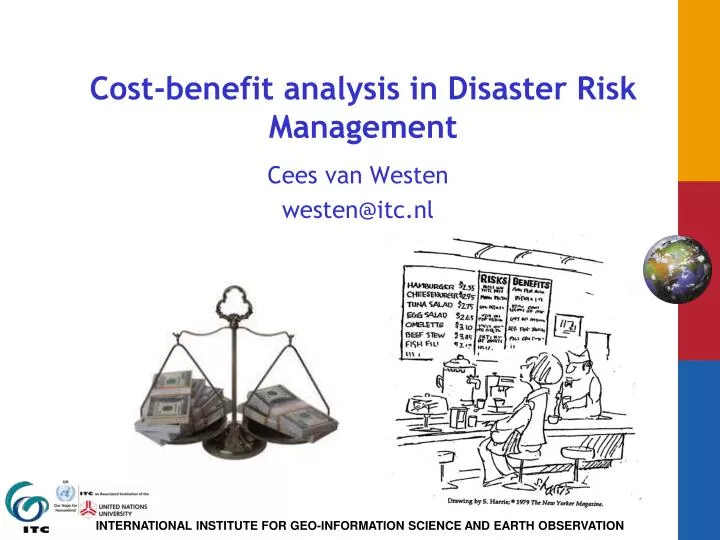
Cost-benefit analysis in Disaster Risk Management Cees van Westen westen@itc.nl
Disaster management cycle • Components: relief, recovery, reconstruction, prevention and preparedness. • Initially most emphasis was given to disaster relief, recovery and reconstruction • Later more attention was given to disaster preparedness. • Eventually the efforts are focusing on disaster prevention and preparedness
Disaster Risk Management Disaster Risk Management (DRM)can be described as an array of measures involving public administration, decentralization, organizational and institutional development (or strengthening), community-based strategies, engineering, settlement development and land use planning. It also takes into consideration environmental issues as part of the risk mitigation and reduction strategies
Risk evaluation versus perception • Risk evaluation is the stage at which values and judgment enter the decision process, explicitly or implicitly, by including consideration of the importance of the estimated risks and the associated social, environmental, and economic consequences, in order to identify a range of alternatives for managing the risks. • We have analyzed the risk either qualitatively or quantitatively. Now questions arise: • Is the risk too high? • Where is the risk too high? • What is too high? • What do the people think? • Risks can classified into involuntary risk and voluntary risks. • Risks associated with natural hazards are often classified as involuntary risk. • The “factual” dimension, which indicates the actual measured level of risk, and which can be expressed in probability of losses (e.g. number of people, building, monetary values) • The “socio-cultural” dimension, which includes how a particular risk is viewed when values and emotions come into play
Risk perception • Risk perception is the way how people/communities/authorities judge the severity of the risk. • Do they know? • Are they worried? • Are they prepared to act? • Who they think should act? • What is it worth to them? • Their personal situation. • Cultural and religious background. • Social background • Economic level • Political background • Level of awareness • Media exposure • Other risks • Risk reduction situation
Risk evaluation. • The ALARP principle is that the residual risk shall be as low as reasonably practicable. Acceptable risk: a risk which the society or impacted individuals are prepared to accept. Actions to further reduce such risk are usually not required unless reasonably practicable measures are available at low cost in terms of money, time and effort. Tolerable risk: a risk within a range that society can live with so as to secure certain net benefits. It is a range of risk regarded as non-negligible and needing to be kept under review and reduced further if possible. ALARP (As Low As Reasonably Practicable) principle: Principle which states that risks, lower than the limit of tolerability, are tolerable only if risk reduction is impracticable or if its cost is grossly in disproportion (depending on the level of risk) to the improvement gained.
Which risk is acceptable? • During the life of an average person, the chance of death is never less than 1:10,000 (1.000E-4): this is due to all causes. • So it would not be realistic to require the risk due to natural disasters to be lower than this. • These curves differ from country to country. No international standards • Voluntary – involuntary risk is also relevant.
F-N curves Risk acceptability is mostly defined on the basis of F-N curves
Risk acceptance criteria in Netherlands • “dyke rings” that protect a part of the country against flooding. • The more important the area, the lower the chance that the dyke ring breaks and the area will be flooded.
Risk Governance Framework • The aim of Risk governance is to involve the various stakeholders within all aspects of risk management. • Risk communication is central. The International Risk Governance Council Risk Governance Framework ( Source: IRGC, 2006)
Risk reduction R = f (H, V, C) R = Risk H = Hazard V = Vulnerability C = Coping capacity Risk can be reduced by: • Reducing the hazard • Reducing the vulnerability of the elements at risk • Reducing the amount of the elements at risk • Increasing the coping capacity
Risk reduction strategies • Structural measures: refer to any physical construction to reduce or avoid possible impacts of hazards, which include engineering measures and construction of hazard-resistant and protective structures and infrastructure • Non-Structural measures: refer to policies, awareness, knowledge development, public commitment, and methods and operating practices, including participatory mechanisms and the provision of information, which can reduce risk and related impacts.
Tools to evaluate best risk reduction measures • Cost Benefit Analysis (CBA) is used to compare costs and benefits of a one specific measures or a set of alternative measures over a period of time for a. CBA assesses the measure(s) mainly on the basis of the efficiency criterion. It requires the monetization of all the effects. The effects that cannot be expressed in monetary terms will be usually described in their original unit of measurement. • Cost Effectiveness Analysis: (CEA) has most of the features of CBA, but does not require the monetization of either the benefits or the costs (usually the benefits). CEA does not show whether the benefits outweigh the costs, but shows which alternative has the lowest costs (with the same level of benefits). CEA is often applied when the norm for a certain level of safety has been set. CEA analyzes which types of solution is the ‘cheapest’ given a certain level of safety standard. • Multi Criteria Analysis (MCE) is a tool that allows comparing alternative measures on multiple criteria. In contrast to CBA, MCE allows the treatment of more than one criterion and does not require the monetization of all the impacts. MCE results in a ranking of alternatives.
c. Which alternative is economically the most attractive? • If all alternatives are all as effective in terms of risk reduction the cheapest alternative (Cost Effectiveness Analysis, CEA) • If effectiveness in risk reduction differs the cheapest alternative in terms of risk reduced (Cost Benefit Analysis, CBA) Flood proofing relocation. Levees
What is an optimal level of a risk reducing measure? • A number (most?) risk reduction measures could be applied in a variable way • Height level of dikes • Earthquake resistance of buildings • Legal restrictions land use • ….. • A higher level of risk reducing measures reduced risk, BUT • diminishing returns • Often at higher variable costs • MORE is not necessarily more beneficial EXAMPLE: small example CBA_risk_reducing
Cost-Benefit Analysis and Damage Assessment – for whom?? • Government and funding agencies • National and provincial governments • Governments/general public • Emergency planners • Insurance companies • Private firms/house owners • Ex-ante project appraisal • Accountability - Tax money • Economic loss - compensation • Identification of critical risk areas • Financial loss • Insurance or other protection measures
Perspective – damage/cost/benefits for whom? • Public: national ministries, provincial governments, emergency planners • Private: private firms, private property owners, insurance companies • Economic values – real values – broad economic perspective • Financial values – monetary values
Cost Benefit Analysis of Risk Reducing Measures • Costs for (structural) risk reducing measures are relatively less difficult to estimate • Estimating the benefits is a major challenge ! We need to know: • Avoided damage • Probability of damage We need to estimate: • how often natural hazard events occur (frequency) • how much damage and losses occur as a result of the event
Damage functions Damage-probability curve Damage-probability curve in case of flood protection against events upto 1:100 years
Basic CBA steps • Define scope of the project • Identify the type of costs and benefits • Put monetary values on costs and benefits • Compare costs and benefits • Calculate profitability indicators/decision criteria • Sensitivity analysis • Make recommendations
What do we need to know of both scenarios? • The costs of both scenarios (investment and annual) • The investment period • The benefits (i.e. annual risk reduction) of both scenarios • The life time of the investment • Discount rate
RiskCity • RiskCity is (not) Tegucigalpa, Honduras • Educational changes
Risk concept • Definition of risk • the probability of harmful consequences, or expected losses (deaths, injuries, property, livelihoods, economic activity disrupted or environment damaged) resulting from interactions between natural or human-induced hazards and vulnerable conditions • Definition of risk assessment: • A methodology to determine the nature and extent of risk by analyzing potential hazards and evaluating existing conditions of vulnerability that could pose a potential threat or harm to people, livelihoods and the environment on which they depend.
RiskCity concept • Go through all steps of a risk assessment • Urban area • Multi-hazard • Developing country • Different approaches
Seismic risk • Step 1: Defining earthquake scenario. • Step 2: Calculate the attenuation • Step 3: Calculate soil amplification • Step 4: Convert PGA to MMI • Step 5: Apply Vulnerability Functions for Building types • Step 6: Apply Vulnerability Functions for Infrastructure types • Step 7: Apply Vulnerability Functions for casualties • If additional information is available: • Step 8: Apply cost information to the buildings and combine with vulnerability to calculate losses for different return periods. • Step 9: Combine loss information for different return periods and calculate the risk by adding up the losses from these periods. • Step 10: Combine information and make summary ISL 2004
Seismic risk • Risk = Hazard * Vulnerability * Amount ISL 2004
100 Discharge 25 10 5 Time Flood hazard modeling • Sobek: a two dimensional hydraulic model. • Input: • Digital Surface Model (Lidar) • Discharge data • Roughness data (landuse) • Output: • Flood depth • Flow velocity • (Per time step) ISL 2004
Flood risk 5 years 50 years 5 years 50 years 10 years 100 years 10 years 100 years 25 years Mapping units 25 years Hazard polygons Buildings Affected ISL 2004
Flood risk • Risk = Hazard * Vulnerability * Amount ISL 2004
Flood risk • Risk = Hazard * Vulnerability * Amount ISL 2004
Calculating buildings in hazard zones Building map Susceptibility Calculates the number of houses in High, Moderate and Low susceptibility zones using a Building footprint map Cross 4426 buildings 9645 buildings 22019 buildings ISL 2004
Results using mapping units High Moderate Low 4426 buildings 9645 buildings 22019 buildings Quantitative risk assessment Only susceptibility Still to do Known now Risk = Hazard * Vulnerability * Amount How much percentage of the high, moderate and low hazard classes may be affected by landsides? In which period will these landslides occur? What is the vulnerability to landslides? Hazard = Spatial probability * Temporal probability The temporal probability that landslides may occur due to a triggering event. Here we will link the return period of the triggering event with the landslides that are caused by it. We have differentiated return periods of: 50, 100, 200, 300 and 400 years. The spatial probability that a particular area would be affected by landslides of the given temporal probability. This is calculated as the landslide density within the landslide susceptibility class. ISL 2004
Density in high Density inmoderate Density inlow From susceptibility to hazard Landslide_ID map If the indication of the high, moderate and low areas susceptibility is correct, different landslide events with different return periods will give different distributions of landslides in these classes. Million dollar information!!! The probability can be estimated by multiplying the temporal probability (1/return/period for annual probability) with the spatial probability (= what is the chance that 1 pixel is affected) Landslide related to different return periods Susceptibility Cross ISL 2004
Calculating hazard Assumption is that events with a larger return period will also trigger those landslides that would be triggered by events from smaller return periods Return periods Susceptibility classes ISL 2004
Calculating Vulnerability Estimating landslide vulnerability is very complex. It requites knowledge on the building types and on the expected landslide volumes and velocities. These are difficult to estimate. In many study landslide vulnerability of buildings is simply taken as 1, assuming complete destruction of the elements at risk. This would, however, in our case give too exaggerated values of risk. Simple assumption: The more buildings there are with 3 floors or higher, the lower will be the landslide vulnerability, as it becomes less likely that large buildings will be destroyed by landslides. Vuln:=iff(PerVacant=1,0,1-(Perc3floor+Percover3floor)) ISL 2004
Calculate losses Losses = Spatial Probability * Consequences Losses = Spatial P * V * A Loss_50_high:=0.0181*vuln*nr_b_high Loss_50_moderate:= 1.31199E-06*vuln*nr_b_moderate Loss_50_low:= 5.96345E-07*vuln*nr_b_low etc ISL 2004
Calculate losses Losses for a return period = sum of losses in high, moderate and low susceptibility areas What can you conclude when you compare the spatial probabilities and consequences for the high, moderate and low susceptibility classes ? ISL 2004
Calculate risk Period ISL 2004
Calculate total risk Total Risk = Area under curve Two methods: 1: Add trendline and integrate trendline 2: Use graphical method with triangles and rectangles ISL 2004